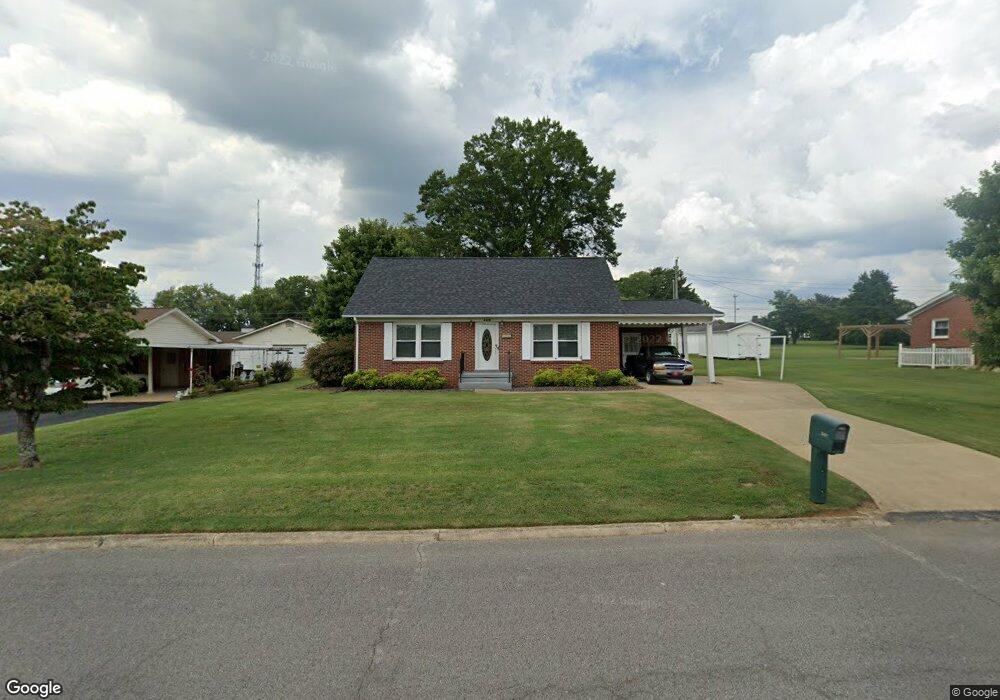
408 9th St Lawrenceburg, TN 38464
Estimated Value: $190,747 - $228,000
--
Bed
2
Baths
1,334
Sq Ft
$161/Sq Ft
Est. Value
About This Home
This home is located at 408 9th St, Lawrenceburg, TN 38464 and is currently estimated at $214,937, approximately $161 per square foot. 408 9th St is a home located in Lawrence County with nearby schools including Ingram Sowell Elementary School, Lawrenceburg Public Elementary School, and David Crockett Elementary School.
Ownership History
Date
Name
Owned For
Owner Type
Purchase Details
Closed on
Apr 28, 2023
Sold by
Smith Marcus Alonzo
Bought by
Smith Larry J
Current Estimated Value
Purchase Details
Closed on
Nov 3, 2008
Sold by
Self Nancy B
Bought by
Smith Marcus
Purchase Details
Closed on
Apr 20, 1998
Sold by
Yokley Royce G and Yokley Shannon K
Bought by
Self Joe H and Self Nancy B
Purchase Details
Closed on
Jul 20, 1995
Bought by
Yokley Royce G and Yokley Shannon K
Purchase Details
Closed on
Sep 24, 1991
Bought by
Brown J L
Purchase Details
Closed on
Mar 29, 1985
Bought by
Shaddix Joyce E Hunter
Create a Home Valuation Report for This Property
The Home Valuation Report is an in-depth analysis detailing your home's value as well as a comparison with similar homes in the area
Home Values in the Area
Average Home Value in this Area
Purchase History
| Date | Buyer | Sale Price | Title Company |
|---|---|---|---|
| Smith Larry J | -- | None Listed On Document | |
| Smith Marcus | $78,000 | -- | |
| Self Joe H | $61,000 | -- | |
| Yokley Royce G | $58,800 | -- | |
| Brown J L | $50,000 | -- | |
| Shaddix Joyce E Hunter | -- | -- |
Source: Public Records
Tax History Compared to Growth
Tax History
| Year | Tax Paid | Tax Assessment Tax Assessment Total Assessment is a certain percentage of the fair market value that is determined by local assessors to be the total taxable value of land and additions on the property. | Land | Improvement |
|---|---|---|---|---|
| 2025 | $1,020 | $32,825 | $0 | $0 |
| 2024 | $1,020 | $32,825 | $5,000 | $27,825 |
| 2023 | $1,020 | $32,825 | $5,000 | $27,825 |
| 2022 | $1,020 | $32,825 | $5,000 | $27,825 |
| 2021 | $863 | $19,650 | $3,750 | $15,900 |
| 2020 | $863 | $19,650 | $3,750 | $15,900 |
| 2019 | $863 | $19,650 | $3,750 | $15,900 |
| 2018 | $863 | $19,650 | $3,750 | $15,900 |
| 2017 | $863 | $19,650 | $3,750 | $15,900 |
| 2016 | $863 | $19,650 | $3,750 | $15,900 |
| 2015 | $818 | $19,650 | $3,750 | $15,900 |
| 2014 | $720 | $17,300 | $2,500 | $14,800 |
Source: Public Records
Map
Nearby Homes