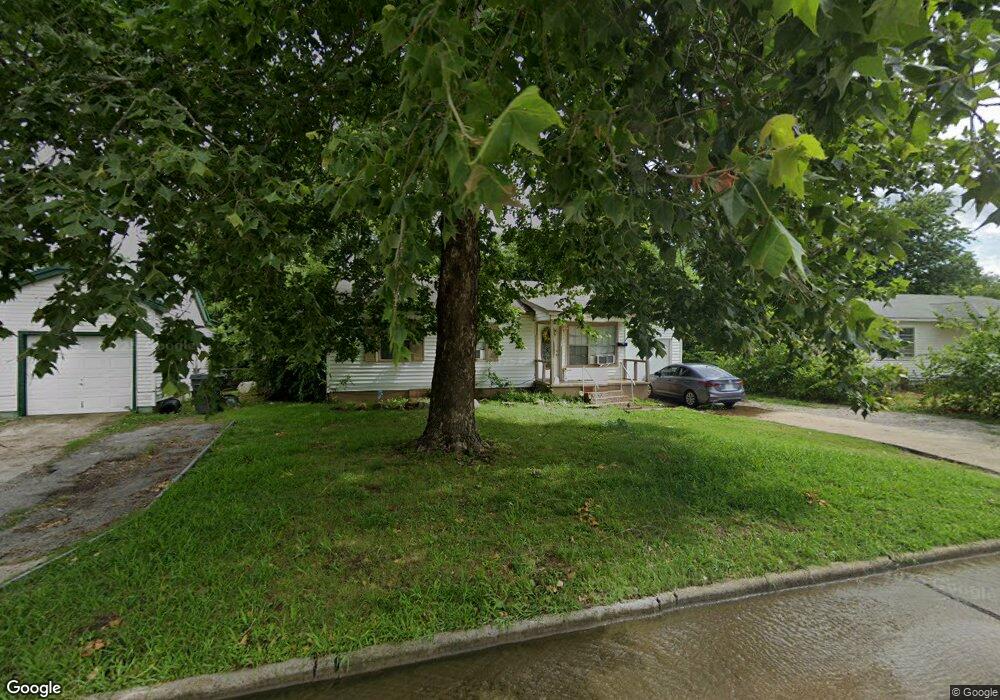
408 Ash St Ardmore, OK 73401
Estimated Value: $81,000 - $112,702
2
Beds
1
Bath
936
Sq Ft
$105/Sq Ft
Est. Value
About This Home
This home is located at 408 Ash St, Ardmore, OK 73401 and is currently estimated at $97,926, approximately $104 per square foot. 408 Ash St is a home located in Carter County with nearby schools including Charles Evans Elementary School, Ardmore Middle School, and Ardmore High School.
Ownership History
Date
Name
Owned For
Owner Type
Purchase Details
Closed on
Aug 26, 2005
Sold by
Frausto Francisco and Frausto Michelle
Bought by
Howell Kevin Scott
Current Estimated Value
Home Financials for this Owner
Home Financials are based on the most recent Mortgage that was taken out on this home.
Original Mortgage
$46,500
Outstanding Balance
$24,041
Interest Rate
5.61%
Mortgage Type
New Conventional
Estimated Equity
$73,885
Purchase Details
Closed on
Oct 13, 2004
Sold by
Wernli Joe L and Wernli Phyllis
Bought by
Frausto Francisco J And
Create a Home Valuation Report for This Property
The Home Valuation Report is an in-depth analysis detailing your home's value as well as a comparison with similar homes in the area
Home Values in the Area
Average Home Value in this Area
Purchase History
| Date | Buyer | Sale Price | Title Company |
|---|---|---|---|
| Howell Kevin Scott | $46,500 | -- | |
| Frausto Francisco J And | $25,000 | -- |
Source: Public Records
Mortgage History
| Date | Status | Borrower | Loan Amount |
|---|---|---|---|
| Open | Howell Kevin Scott | $46,500 |
Source: Public Records
Tax History Compared to Growth
Tax History
| Year | Tax Paid | Tax Assessment Tax Assessment Total Assessment is a certain percentage of the fair market value that is determined by local assessors to be the total taxable value of land and additions on the property. | Land | Improvement |
|---|---|---|---|---|
| 2025 | $483 | $5,137 | $1,200 | $3,937 |
| 2024 | $483 | $4,892 | $1,200 | $3,692 |
| 2023 | $460 | $4,659 | $1,200 | $3,459 |
| 2022 | $424 | $4,438 | $1,200 | $3,238 |
| 2021 | $587 | $5,817 | $1,200 | $4,617 |
| 2020 | $596 | $5,991 | $720 | $5,271 |
| 2019 | $582 | $5,990 | $720 | $5,270 |
| 2018 | $572 | $5,791 | $696 | $5,095 |
| 2017 | $504 | $5,516 | $663 | $4,853 |
| 2016 | $490 | $5,253 | $685 | $4,568 |
| 2015 | $384 | $5,003 | $366 | $4,637 |
| 2014 | $366 | $4,764 | $366 | $4,398 |
Source: Public Records
Map
Nearby Homes
- 1740 Tiverton St
- 1750 Mount Washington Rd
- 1817 Comanche St
- 1714 Salisbury St
- 430 Locust St
- 434 Locust St NW
- 505 Campbell St
- 11 Turner St
- 210 15th Ave NW
- 0 15th Unit 2546881
- 412 Wandering Way
- 520 Northwest Ave
- 1409 Mount Washington Rd
- 703 Cottonwood St
- 625 Northwest Ave
- 00 N Rockford Rd
- 715 Ash St
- 25 Hillcrest St
- 513 Northwest Blvd
- 800 Cottonwood St