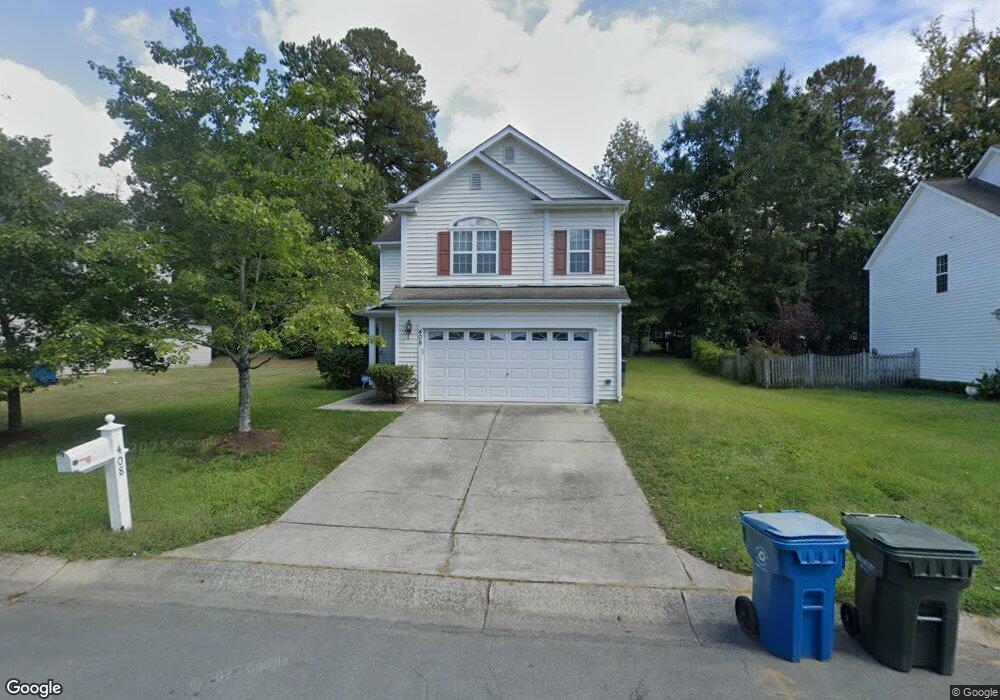
408 Burrell Rd Durham, NC 27703
Eastern Durham NeighborhoodEstimated Value: $333,000 - $371,000
3
Beds
3
Baths
1,739
Sq Ft
$205/Sq Ft
Est. Value
About This Home
This home is located at 408 Burrell Rd, Durham, NC 27703 and is currently estimated at $356,206, approximately $204 per square foot. 408 Burrell Rd is a home located in Durham County with nearby schools including Glenn Elementary, John W Neal Middle School, and Southern School of Energy & Sustainability.
Ownership History
Date
Name
Owned For
Owner Type
Purchase Details
Closed on
Mar 19, 2019
Sold by
Gladney Jocelyn S and Allsbrook Shera Wayne
Bought by
Naranjo Sebastian Arias and Castaneda Mayra J Acevedo
Current Estimated Value
Home Financials for this Owner
Home Financials are based on the most recent Mortgage that was taken out on this home.
Original Mortgage
$201,760
Outstanding Balance
$176,298
Interest Rate
4.4%
Mortgage Type
New Conventional
Estimated Equity
$179,908
Purchase Details
Closed on
Jul 1, 2005
Sold by
Puccio Miguel and Puccio Kelly C
Bought by
Gladney Jocelyn S
Home Financials for this Owner
Home Financials are based on the most recent Mortgage that was taken out on this home.
Original Mortgage
$32,200
Interest Rate
5.54%
Mortgage Type
Stand Alone Second
Purchase Details
Closed on
Aug 15, 2002
Sold by
Westfield Homes Of North Carolina Inc
Bought by
Puccio Miguel
Home Financials for this Owner
Home Financials are based on the most recent Mortgage that was taken out on this home.
Original Mortgage
$144,890
Interest Rate
6.52%
Create a Home Valuation Report for This Property
The Home Valuation Report is an in-depth analysis detailing your home's value as well as a comparison with similar homes in the area
Home Values in the Area
Average Home Value in this Area
Purchase History
| Date | Buyer | Sale Price | Title Company |
|---|---|---|---|
| Naranjo Sebastian Arias | $208,000 | None Available | |
| Gladney Jocelyn S | $161,000 | -- | |
| Puccio Miguel | $150,000 | -- |
Source: Public Records
Mortgage History
| Date | Status | Borrower | Loan Amount |
|---|---|---|---|
| Open | Naranjo Sebastian Arias | $201,760 | |
| Previous Owner | Gladney Jocelyn S | $32,200 | |
| Previous Owner | Puccio Miguel | $144,890 |
Source: Public Records
Tax History
| Year | Tax Paid | Tax Assessment Tax Assessment Total Assessment is a certain percentage of the fair market value that is determined by local assessors to be the total taxable value of land and additions on the property. | Land | Improvement |
|---|---|---|---|---|
| 2025 | $3,654 | $368,567 | $92,800 | $275,767 |
| 2024 | $2,511 | $180,047 | $31,925 | $148,122 |
| 2023 | $2,358 | $180,047 | $31,925 | $148,122 |
| 2022 | $2,304 | $180,047 | $31,925 | $148,122 |
| 2021 | $2,294 | $180,047 | $31,925 | $148,122 |
| 2020 | $2,240 | $180,047 | $31,925 | $148,122 |
| 2019 | $2,240 | $180,047 | $31,925 | $148,122 |
| 2018 | $2,102 | $154,946 | $25,540 | $129,406 |
| 2017 | $2,086 | $154,946 | $25,540 | $129,406 |
| 2016 | $2,016 | $154,946 | $25,540 | $129,406 |
| 2015 | $2,247 | $162,291 | $30,750 | $131,541 |
| 2014 | $2,247 | $162,291 | $30,750 | $131,541 |
Source: Public Records
Map
Nearby Homes
- 608 Chalcedony Ct
- 507 Lodestone Dr
- 3708 Thornwood Dr
- 521 Quartz Dr
- 502 Quartz Dr
- 913 Valmet Dr
- 3900 Mary Martin Rd
- 3822 Mary Martin Rd
- 1005 Sweet Cream Ct
- 1025 Sweet Cream Ct
- 5105 Hadrian Dr
- 914 Flanders Dr
- 3511 Thornwood Dr
- 1113 Homecoming Way
- 912 Obsidian Way
- 1113 Kindness Ln
- 5409 Hadrian Dr
- 1050 Gentle Reed Dr
- 7 Duxford Ct
- 4505 Tyne Dr
- 410 Burrell Rd
- 406 Burrell Rd
- 412 Burrell Rd
- 623 N Mineral Springs Rd
- 404 Burrell Rd
- 627 N Mineral Springs Rd
- 407 Burrell Rd
- 405 Burrell Rd
- 619 N Mineral Springs Rd
- 409 Burrell Rd
- 414 Burrell Rd
- 403 Burrell Rd
- 402 Burrell Rd
- 629 N Mineral Springs Rd
- 411 Burrell Rd
- 615 N Mineral Springs Rd
- 416 Burrell Rd
- 401 Burrell Rd
- 413 Burrell Rd
- 626 N Mineral Springs Rd
Your Personal Tour Guide
Ask me questions while you tour the home.