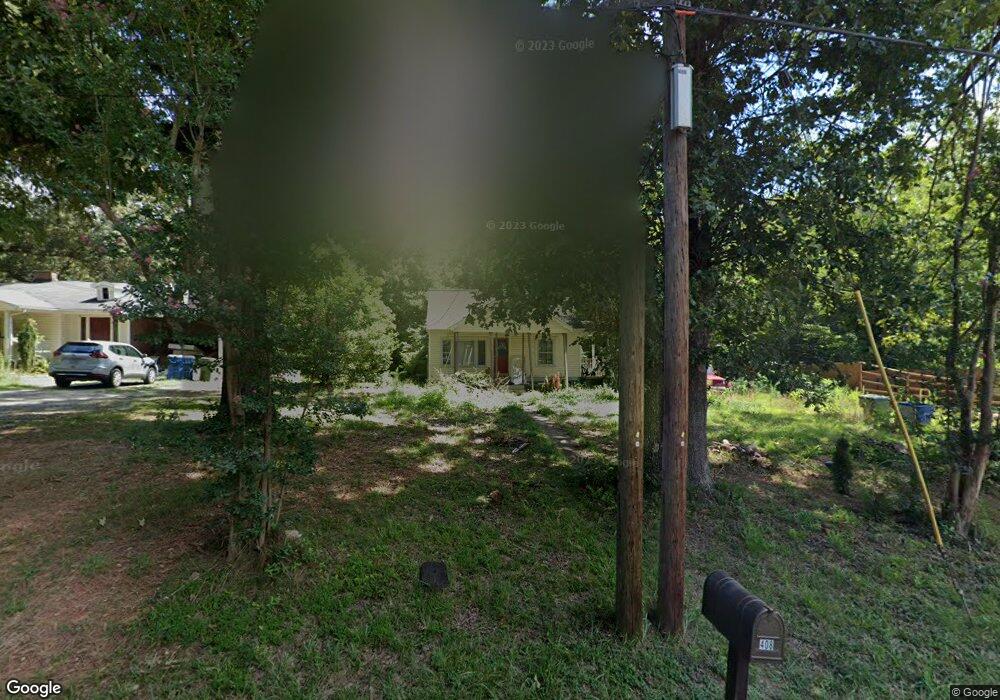
408 Cherry St Belmont, NC 28012
Estimated Value: $197,000 - $237,000
2
Beds
1
Bath
1,375
Sq Ft
$161/Sq Ft
Est. Value
About This Home
This home is located at 408 Cherry St, Belmont, NC 28012 and is currently estimated at $220,966, approximately $160 per square foot. 408 Cherry St is a home located in Gaston County with nearby schools including Catawba Heights Elementary School, Mount Holly Middle School, and South Point High School.
Ownership History
Date
Name
Owned For
Owner Type
Purchase Details
Closed on
Jan 10, 2019
Sold by
Wilmington Savings Fund Society Fsb
Bought by
Clark Martin and Clark Earnest
Current Estimated Value
Purchase Details
Closed on
Aug 14, 2018
Sold by
G2 Tax Investments Llc
Bought by
Wilmington Savings Fund Society Fsb and Residential Credit Opportunities Trust
Purchase Details
Closed on
Jul 13, 2009
Sold by
Brown Katheryne R
Bought by
Metzler Alicia A
Home Financials for this Owner
Home Financials are based on the most recent Mortgage that was taken out on this home.
Original Mortgage
$116,688
Interest Rate
4.88%
Mortgage Type
Purchase Money Mortgage
Purchase Details
Closed on
Jan 18, 2008
Sold by
Federal National Mortgage Association
Bought by
Brown Katheryne R
Home Financials for this Owner
Home Financials are based on the most recent Mortgage that was taken out on this home.
Original Mortgage
$50,111
Interest Rate
5.94%
Mortgage Type
Purchase Money Mortgage
Purchase Details
Closed on
Oct 1, 2007
Sold by
Ledford Michael and Ledford Gina
Bought by
Federal National Mortgage Association
Purchase Details
Closed on
May 4, 1999
Sold by
Staton Harvey Owen and Staton Vickie D
Bought by
Ledford Michael and Ledford Gina
Create a Home Valuation Report for This Property
The Home Valuation Report is an in-depth analysis detailing your home's value as well as a comparison with similar homes in the area
Home Values in the Area
Average Home Value in this Area
Purchase History
| Date | Buyer | Sale Price | Title Company |
|---|---|---|---|
| Clark Martin | $93,000 | None Available | |
| Wilmington Savings Fund Society Fsb | $100,000 | None Available | |
| Metzler Alicia A | $114,500 | None Available | |
| Brown Katheryne R | -- | None Available | |
| Federal National Mortgage Association | $85,323 | None Available | |
| Ledford Michael | $78,000 | -- |
Source: Public Records
Mortgage History
| Date | Status | Borrower | Loan Amount |
|---|---|---|---|
| Previous Owner | Metzler Alicia A | $116,688 | |
| Previous Owner | Brown Katheryne R | $50,111 |
Source: Public Records
Tax History Compared to Growth
Tax History
| Year | Tax Paid | Tax Assessment Tax Assessment Total Assessment is a certain percentage of the fair market value that is determined by local assessors to be the total taxable value of land and additions on the property. | Land | Improvement |
|---|---|---|---|---|
| 2025 | $1,991 | $198,340 | $25,000 | $173,340 |
| 2024 | $1,991 | $198,340 | $25,000 | $173,340 |
| 2023 | $2,013 | $198,340 | $25,000 | $173,340 |
| 2022 | $1,376 | $106,220 | $16,500 | $89,720 |
| 2021 | $1,397 | $106,220 | $16,500 | $89,720 |
| 2019 | $1,407 | $106,220 | $16,500 | $89,720 |
| 2018 | $1,081 | $77,203 | $14,400 | $62,803 |
| 2017 | $1,081 | $77,203 | $14,400 | $62,803 |
| 2016 | $673 | $77,301 | $0 | $0 |
| 2014 | $543 | $62,390 | $13,500 | $48,890 |
Source: Public Records
Map
Nearby Homes
- 502 Cherry St
- 106 W Henry St
- 102 Fire Department Dr
- 108 E Main St
- 116 Maggie Dr
- 128 Coral Rutledge Dr
- 102 Woodstone Dr
- 105 Abel Peterson Dr
- 135 Coral Rutledge Dr Unit L 37
- 107 Oakland Rd
- 105 E Catawba Dr
- 402 Beaty Rd
- 305 E Henry St
- 5235 Clearwater Lake Rd
- 1114 Cason St Unit 6
- 1525 Perfection Ave
- 101 Oak Trail
- 200 Belmont Mount Holly Rd
- 132 Oak Trail
- 227 Howard St
- 408 Cherry St Unit P/364
- 410 Cherry St
- 412 Cherry St
- 406 Cherry St
- 404 Cherry St
- 414 Cherry St
- 409 Cherry St
- 405 Cherry St
- 405 Cherry St
- 411 Cherry St
- 107 Robinson St
- 402 Cherry St
- 400 Cherry St
- 400 Cherry St
- 400 Cherry St
- 400 Cherry St Unit C
- 226 Brookwood Rd
- 226 Brookwood Rd
- 226 Brookwood Rd
- 226 Brookwood Rd