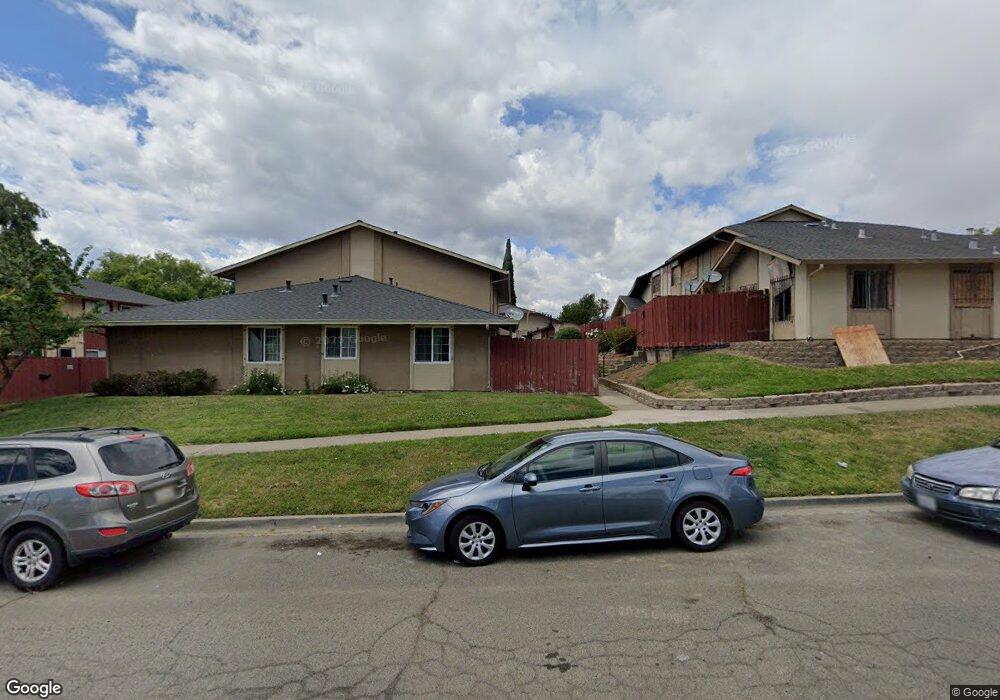
408 Corcoran Ave Unit 2 Vallejo, CA 94589
North Vallejo NeighborhoodEstimated Value: $201,000 - $225,000
2
Beds
2
Baths
880
Sq Ft
$243/Sq Ft
Est. Value
About This Home
This home is located at 408 Corcoran Ave Unit 2, Vallejo, CA 94589 and is currently estimated at $213,550, approximately $242 per square foot. 408 Corcoran Ave Unit 2 is a home located in Solano County with nearby schools including Elsa Widenmann Elementary, Solano Middle School, and Vallejo High School.
Ownership History
Date
Name
Owned For
Owner Type
Purchase Details
Closed on
Sep 18, 2023
Sold by
Ali Muhammad Adnan and Farheen Asharaf
Bought by
Ali Muhammad Adnan and Master Farheen Asharaf Bhai
Current Estimated Value
Purchase Details
Closed on
Jan 19, 2022
Sold by
Hubert Landingham
Bought by
Hubert Arthur Landingham Living Trust
Purchase Details
Closed on
Jan 13, 2022
Sold by
Hubert Arthur Landingham Living Trust
Bought by
Mi Muhammad Adnan and Master Farheen Asharaf Bhai
Purchase Details
Closed on
Jan 14, 2004
Sold by
Landingham Hubert A
Bought by
Landingham Hubert Arthur and The Hubert Arthur Landingham L
Home Financials for this Owner
Home Financials are based on the most recent Mortgage that was taken out on this home.
Original Mortgage
$101,807
Interest Rate
5.86%
Mortgage Type
Purchase Money Mortgage
Create a Home Valuation Report for This Property
The Home Valuation Report is an in-depth analysis detailing your home's value as well as a comparison with similar homes in the area
Home Values in the Area
Average Home Value in this Area
Purchase History
| Date | Buyer | Sale Price | Title Company |
|---|---|---|---|
| Ali Muhammad Adnan | -- | Placer Title | |
| Hubert Arthur Landingham Living Trust | -- | -- | |
| Mi Muhammad Adnan | $189,000 | Placer Title | |
| Landingham Hubert Arthur | -- | -- |
Source: Public Records
Mortgage History
| Date | Status | Borrower | Loan Amount |
|---|---|---|---|
| Previous Owner | Landingham Hubert Arthur | $101,807 |
Source: Public Records
Tax History
| Year | Tax Paid | Tax Assessment Tax Assessment Total Assessment is a certain percentage of the fair market value that is determined by local assessors to be the total taxable value of land and additions on the property. | Land | Improvement |
|---|---|---|---|---|
| 2025 | $3,331 | $200,565 | $49,875 | $150,690 |
| 2024 | $3,331 | $196,634 | $48,898 | $147,736 |
| 2023 | $3,124 | $192,780 | $47,940 | $144,840 |
| 2022 | $1,705 | $74,979 | $24,992 | $49,987 |
| 2021 | $1,664 | $73,509 | $24,502 | $49,007 |
| 2020 | $1,646 | $72,756 | $24,251 | $48,505 |
| 2019 | $1,570 | $71,330 | $23,776 | $47,554 |
| 2018 | $1,451 | $69,932 | $23,310 | $46,622 |
| 2017 | $1,361 | $68,561 | $22,853 | $45,708 |
| 2016 | $800 | $67,217 | $22,405 | $44,812 |
| 2015 | $790 | $66,208 | $22,069 | $44,139 |
| 2014 | $655 | $54,000 | $15,000 | $39,000 |
Source: Public Records
Map
Nearby Homes
- 151 Marquette Ave
- 102 Dartmouth Ave
- 203 Baylor Dr Unit 11
- 141 Dartmouth Ave
- 818 Falcon Dr
- 106 Fieldstone Way
- 300 College Ave
- 121 Forsythia Ct
- 475 Whitney Ave
- 240 Rinaldo Dr
- 408 Lakeside Dr
- 35 Marla Dr
- 121 Notre Dame Ct
- 316 Meadows Dr
- 1815 Mini Dr
- 147 Erin Dr
- 148 Obrien Cir
- 130 Kennison Ct
- 2555 Flosden Rd Unit 117
- 2555 Flosden Rd Unit 65
- 408 Corcoran Ave Unit 2
- 408 Corcoran Ave Unit 3
- 408 Corcoran Ave
- 408 Corcoran Ave Unit 1
- 106 Amherst Ave
- 112 Amherst Ave
- 420 Baylor Dr Unit 103
- 420 Baylor Dr Unit 2
- 420 Baylor Dr Unit 1
- 420 Corcoran Ave Unit 2
- 420 Corcoran Ave Unit 1
- 420 Corcoran Ave Unit 4
- 420 Corcoran Ave
- 420 Corcoran Ave
- 420 Corcoran Ave Unit 99
- 412 Corcoran Ave Unit 19
- 412 Corcoran Ave Unit 20
- 412 Corcoran Ave
- 412 Corcoran Ave
- 100 Amherst Ave
Your Personal Tour Guide
Ask me questions while you tour the home.