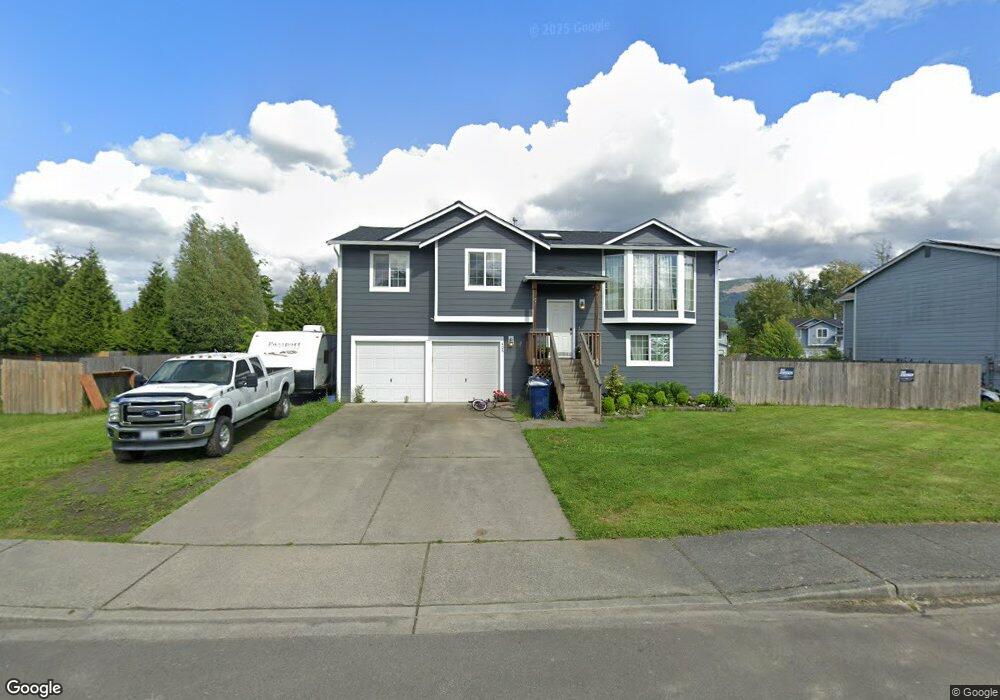
408 E 2nd St Nooksack, WA 98247
Estimated Value: $520,000 - $604,000
3
Beds
2
Baths
1,299
Sq Ft
$424/Sq Ft
Est. Value
About This Home
This home is located at 408 E 2nd St, Nooksack, WA 98247 and is currently estimated at $550,908, approximately $424 per square foot. 408 E 2nd St is a home located in Whatcom County with nearby schools including Nooksack Elementary School, Everson Elementary School, and Sumas Elementary School.
Ownership History
Date
Name
Owned For
Owner Type
Purchase Details
Closed on
Nov 18, 2009
Sold by
Himalaya Homes
Bought by
Richbaw Steve S and Richbaw Jaisha C
Current Estimated Value
Home Financials for this Owner
Home Financials are based on the most recent Mortgage that was taken out on this home.
Original Mortgage
$205,164
Outstanding Balance
$131,151
Interest Rate
4.83%
Mortgage Type
FHA
Estimated Equity
$419,757
Purchase Details
Closed on
Mar 1, 2006
Sold by
Burch Daniel W and Burch Edee
Bought by
Himalaya Homes Inc
Home Financials for this Owner
Home Financials are based on the most recent Mortgage that was taken out on this home.
Original Mortgage
$2,633,750
Interest Rate
6.18%
Mortgage Type
Unknown
Create a Home Valuation Report for This Property
The Home Valuation Report is an in-depth analysis detailing your home's value as well as a comparison with similar homes in the area
Purchase History
| Date | Buyer | Sale Price | Title Company |
|---|---|---|---|
| Richbaw Steve S | $209,230 | Chicago Title Insurance | |
| Himalaya Homes Inc | $3,762,780 | First American Title Insuran |
Source: Public Records
Mortgage History
| Date | Status | Borrower | Loan Amount |
|---|---|---|---|
| Open | Richbaw Steve S | $205,164 | |
| Previous Owner | Himalaya Homes Inc | $2,633,750 |
Source: Public Records
Tax History
| Year | Tax Paid | Tax Assessment Tax Assessment Total Assessment is a certain percentage of the fair market value that is determined by local assessors to be the total taxable value of land and additions on the property. | Land | Improvement |
|---|---|---|---|---|
| 2025 | $4,583 | $517,154 | $188,100 | $329,054 |
| 2024 | $4,454 | $501,028 | $180,000 | $321,028 |
| 2023 | $4,454 | $505,286 | $137,744 | $367,542 |
| 2022 | $4,078 | $455,221 | $124,096 | $331,125 |
| 2021 | $3,782 | $376,221 | $102,560 | $273,661 |
| 2020 | $3,626 | $305,878 | $83,384 | $222,494 |
| 2019 | $3,125 | $305,878 | $83,384 | $222,494 |
| 2018 | $3,485 | $293,464 | $80,000 | $213,464 |
| 2017 | $3,122 | $244,052 | $63,800 | $180,252 |
| 2016 | $2,984 | $225,212 | $58,850 | $166,362 |
| 2015 | $2,542 | $216,023 | $56,760 | $159,263 |
| 2014 | -- | $209,325 | $55,000 | $154,325 |
| 2013 | -- | $209,325 | $55,000 | $154,325 |
Source: Public Records
Map
Nearby Homes
- 407 E 2nd St
- 209 Nooksack Ave
- 404 W 3rd St
- 310 W 3rd St
- 308 W 3rd St
- 412 W 3rd St
- 304 W 3rd St
- 705 E 6th St
- 405 Jackson Ct
- 109 W 2nd St
- 3292 S Pass Rd
- 303 Hayes St
- 107 Thendara Park Dr Unit C
- 7554 Nooksack Rd
- 207 E Main St
- 110 Baker St Unit A & B
- 108 Baker St Unit 1-4
- 216 W 4th St
- 208 W 4th St
- 413 W 4th St
- 407 Allison Way
- 406 E 2nd St
- 410 E 2nd St
- 409 Allison Way
- 403 E 2nd Ave
- 412 E 2nd St
- 409 E 2nd St
- 411 Allison Way
- 312 Allison Way
- 314 Allison Way
- 414 E 2nd St
- 310 Allison Way
- 316 Allison Way
- 306 Allison Way
- 308 Allison Way
- 402 Allison Way
- 304 Allison Way
- 404 Allison Way
- 413 Allison Way
- 302 Allison Way
Your Personal Tour Guide
Ask me questions while you tour the home.