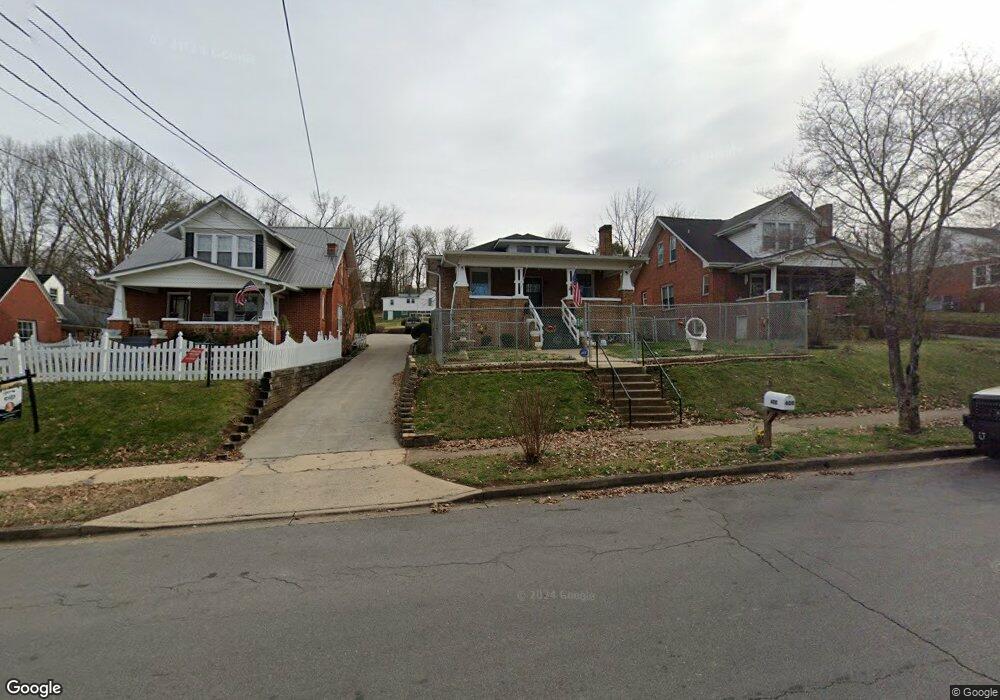
408 E H St Elizabethton, TN 37643
Estimated Value: $224,000 - $245,238
3
Beds
1
Bath
1,229
Sq Ft
$189/Sq Ft
Est. Value
About This Home
This home is located at 408 E H St, Elizabethton, TN 37643 and is currently estimated at $232,060, approximately $188 per square foot. 408 E H St is a home located in Carter County with nearby schools including Elizabethton High School and East Tn Christian Home & Academy.
Ownership History
Date
Name
Owned For
Owner Type
Purchase Details
Closed on
Jan 8, 2007
Sold by
Eggers Joel Vernon
Bought by
Gray Kendall K
Current Estimated Value
Purchase Details
Closed on
Sep 30, 2002
Sold by
Oliver Mary S
Bought by
Eggers Joel V
Purchase Details
Closed on
Jul 8, 1999
Bought by
Eggers Joel V and Eggers Gayle S
Purchase Details
Closed on
May 3, 1988
Bought by
Oliver Mary S
Purchase Details
Closed on
May 2, 1975
Bought by
Tadlock Randolph O and Tadlock Patricia L
Purchase Details
Closed on
Feb 21, 1975
Create a Home Valuation Report for This Property
The Home Valuation Report is an in-depth analysis detailing your home's value as well as a comparison with similar homes in the area
Home Values in the Area
Average Home Value in this Area
Purchase History
| Date | Buyer | Sale Price | Title Company |
|---|---|---|---|
| Gray Kendall K | $115,000 | -- | |
| Eggers Joel V | $72,000 | -- | |
| Eggers Joel V | $72,000 | -- | |
| Oliver Mary S | $45,000 | -- | |
| Tadlock Randolph O | -- | -- | |
| -- | -- | -- |
Source: Public Records
Tax History Compared to Growth
Tax History
| Year | Tax Paid | Tax Assessment Tax Assessment Total Assessment is a certain percentage of the fair market value that is determined by local assessors to be the total taxable value of land and additions on the property. | Land | Improvement |
|---|---|---|---|---|
| 2024 | $1,152 | $34,925 | $4,600 | $30,325 |
| 2023 | $1,152 | $34,925 | $0 | $0 |
| 2022 | $1,214 | $33,725 | $4,600 | $29,125 |
| 2021 | $685 | $33,725 | $4,600 | $29,125 |
| 2020 | $1,123 | $33,725 | $4,600 | $29,125 |
| 2019 | $1,123 | $25,975 | $2,425 | $23,550 |
| 2018 | $1,107 | $25,975 | $2,425 | $23,550 |
| 2017 | $1,107 | $25,975 | $2,425 | $23,550 |
| 2016 | $1,101 | $25,975 | $2,425 | $23,550 |
| 2015 | $1,104 | $25,975 | $2,425 | $23,550 |
| 2014 | $1,164 | $27,250 | $2,425 | $24,825 |
Source: Public Records
Map
Nearby Homes