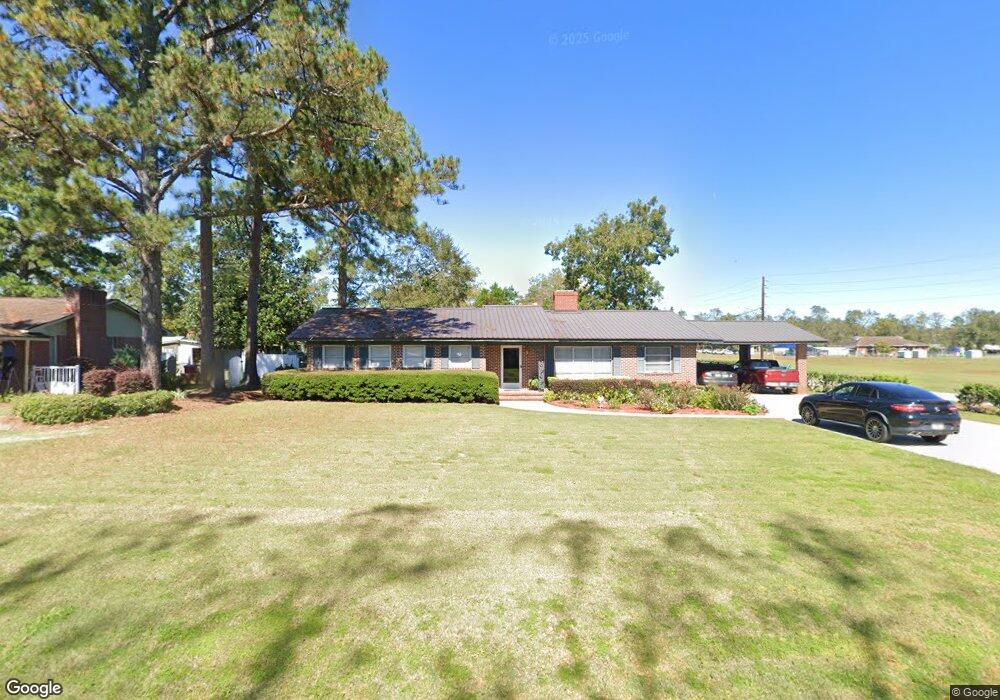
408 Hillcrest Blvd Blackshear, GA 31516
Estimated Value: $215,000 - $290,000
4
Beds
4
Baths
3,102
Sq Ft
$81/Sq Ft
Est. Value
About This Home
This home is located at 408 Hillcrest Blvd, Blackshear, GA 31516 and is currently estimated at $250,314, approximately $80 per square foot. 408 Hillcrest Blvd is a home located in Pierce County with nearby schools including Pierce County High School, Southeast Christian Academy, and Truth Christian Academy.
Ownership History
Date
Name
Owned For
Owner Type
Purchase Details
Closed on
Jan 21, 2015
Sold by
The Heritage Bank
Bought by
Anderson Nathaniel J and Anderson Emily M
Current Estimated Value
Home Financials for this Owner
Home Financials are based on the most recent Mortgage that was taken out on this home.
Original Mortgage
$66,500
Outstanding Balance
$22,513
Interest Rate
3.9%
Mortgage Type
New Conventional
Estimated Equity
$227,801
Purchase Details
Closed on
May 6, 2014
Sold by
Mobley William Keith
Bought by
The Heritage Bank
Purchase Details
Closed on
Jun 10, 2004
Sold by
Lee Everett I and Lee Deb
Bought by
Mobley William K
Purchase Details
Closed on
Feb 8, 1994
Sold by
Tanner Donna O
Bought by
Lee Everett I and Lee Deborah F
Purchase Details
Closed on
Jun 14, 1983
Sold by
Dixon Jean Fka Mrs Robert A Johnson
Bought by
Tanner Donna O and Frank Tanner H
Purchase Details
Closed on
Jan 3, 1970
Sold by
Dixon Jean B Fka Jean B Johsnon Exec
Bought by
Dixon Jean B Fka Jean B Johnson
Create a Home Valuation Report for This Property
The Home Valuation Report is an in-depth analysis detailing your home's value as well as a comparison with similar homes in the area
Home Values in the Area
Average Home Value in this Area
Purchase History
| Date | Buyer | Sale Price | Title Company |
|---|---|---|---|
| Anderson Nathaniel J | $70,000 | -- | |
| The Heritage Bank | -- | -- | |
| Mobley William K | $108,500 | -- | |
| Lee Everett I | $79,500 | -- | |
| Tanner Donna O | $71,500 | -- | |
| Dixon Jean B Fka Jean B Johnson | -- | -- |
Source: Public Records
Mortgage History
| Date | Status | Borrower | Loan Amount |
|---|---|---|---|
| Open | Anderson Nathaniel J | $66,500 |
Source: Public Records
Tax History Compared to Growth
Tax History
| Year | Tax Paid | Tax Assessment Tax Assessment Total Assessment is a certain percentage of the fair market value that is determined by local assessors to be the total taxable value of land and additions on the property. | Land | Improvement |
|---|---|---|---|---|
| 2025 | $2,178 | $93,206 | $2,460 | $90,746 |
| 2024 | $2,178 | $91,728 | $2,460 | $89,268 |
| 2023 | $2,231 | $97,909 | $2,460 | $95,449 |
| 2022 | $2,188 | $65,881 | $3,330 | $62,551 |
| 2021 | $2,323 | $63,291 | $3,330 | $59,961 |
| 2020 | $2,322 | $60,701 | $3,330 | $57,371 |
| 2019 | $2,322 | $60,701 | $3,330 | $57,371 |
| 2018 | $2,295 | $57,785 | $3,330 | $54,455 |
| 2017 | $2,342 | $56,240 | $3,330 | $52,910 |
| 2016 | $2,277 | $56,240 | $3,330 | $52,910 |
| 2015 | $2,007 | $56,240 | $3,330 | $52,910 |
| 2014 | $2,007 | $70,064 | $3,330 | $66,734 |
| 2013 | $2,007 | $70,063 | $3,329 | $66,734 |
Source: Public Records
Map
Nearby Homes
- 322 Mcgregor St
- 515 Grady St
- 420 Jackson St
- 3551 Cason Rd
- 810 Jackson St
- 331 Central Ave W
- 3360 Strickland Avenue Extension
- 3344 Strickland Ave
- 0001 Georgia 121
- ST. ROUTE 121 Georgia 121
- 706 Jenkins St
- 121 Beaver Dr
- 862 Watson St
- 622 E Main St
- 131 Fawn Ln
- 2936 Piney Grove Cir
- 1157 Tanner Cir
- 101 Fawn Ln
- 830 Jane St
- 915 Jane St
- 416 Hillcrest Blvd
- 0 Hillcrest Blvd
- 615 Nimmer St
- 405 Hillcrest Blvd
- 424 Hillcrest Blvd
- 413 Hillcrest Blvd
- 321 Hillcrest Blvd
- 408 Mcgregor St
- 604 Hendry St
- 317 Hillcrest Blvd
- 402 Mcgregor St
- 404 Johns St
- 332 Mcgregor St
- 416 Johns St
- 510 Hendry St
- 612 Hendry St
- 616 Hendry St
- 00 Hendry St
- 0 Hendry St
- 1234 Multi Location