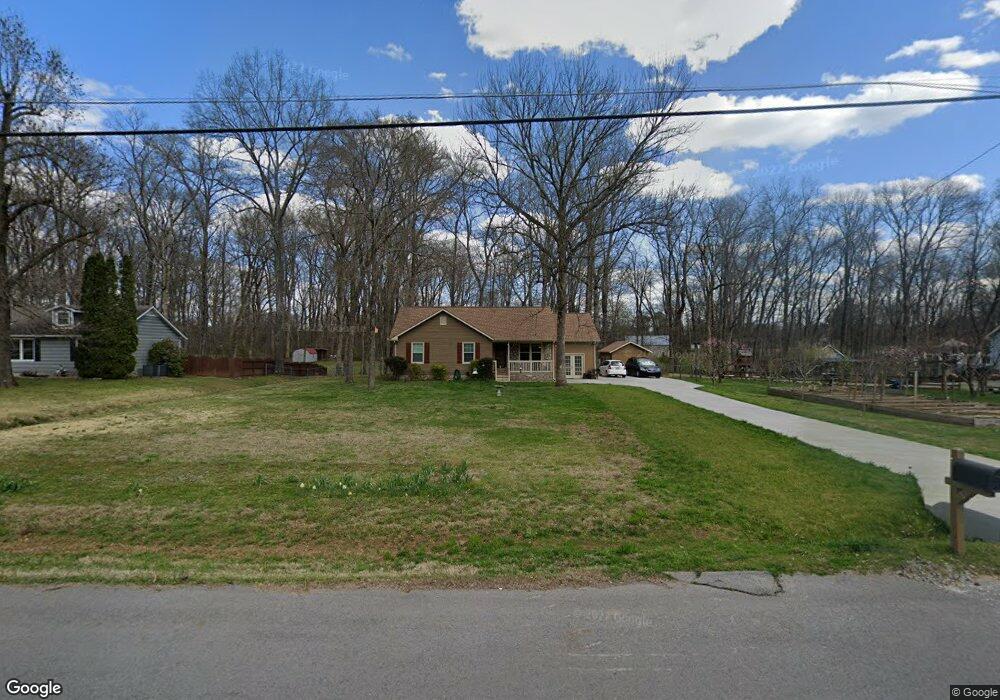
408 Karstridge Rd Smyrna, TN 37167
Estimated Value: $313,000 - $386,000
--
Bed
2
Baths
1,556
Sq Ft
$232/Sq Ft
Est. Value
About This Home
This home is located at 408 Karstridge Rd, Smyrna, TN 37167 and is currently estimated at $360,529, approximately $231 per square foot. 408 Karstridge Rd is a home located in Rutherford County with nearby schools including Stewartsboro Elementary School, Stewarts Creek Middle School, and Stewarts Creek High School.
Ownership History
Date
Name
Owned For
Owner Type
Purchase Details
Closed on
Nov 30, 2011
Sold by
Mcguire David Shawn
Bought by
Carpenter Donovan W
Current Estimated Value
Home Financials for this Owner
Home Financials are based on the most recent Mortgage that was taken out on this home.
Original Mortgage
$92,591
Outstanding Balance
$64,512
Interest Rate
4.4%
Mortgage Type
FHA
Estimated Equity
$296,017
Purchase Details
Closed on
Dec 1, 2006
Sold by
Hud
Bought by
Shawn Mcguire David
Home Financials for this Owner
Home Financials are based on the most recent Mortgage that was taken out on this home.
Original Mortgage
$118,000
Interest Rate
6.29%
Purchase Details
Closed on
Apr 4, 2006
Sold by
Jones William C
Bought by
Hud
Purchase Details
Closed on
Apr 4, 2000
Sold by
Lane Charles J
Bought by
Jones William C and Jones Sonia L
Purchase Details
Closed on
May 3, 1995
Sold by
Lund Timothy W
Bought by
Lane Charles J
Create a Home Valuation Report for This Property
The Home Valuation Report is an in-depth analysis detailing your home's value as well as a comparison with similar homes in the area
Home Values in the Area
Average Home Value in this Area
Purchase History
| Date | Buyer | Sale Price | Title Company |
|---|---|---|---|
| Carpenter Donovan W | $95,000 | -- | |
| Shawn Mcguire David | $118,000 | -- | |
| Hud | $105,563 | -- | |
| Jones William C | $100,000 | -- | |
| Lane Charles J | $76,500 | -- |
Source: Public Records
Mortgage History
| Date | Status | Borrower | Loan Amount |
|---|---|---|---|
| Open | Carpenter Donovan W | $92,591 | |
| Previous Owner | Lane Charles J | $118,000 |
Source: Public Records
Tax History Compared to Growth
Tax History
| Year | Tax Paid | Tax Assessment Tax Assessment Total Assessment is a certain percentage of the fair market value that is determined by local assessors to be the total taxable value of land and additions on the property. | Land | Improvement |
|---|---|---|---|---|
| 2025 | $1,198 | $63,850 | $15,125 | $48,725 |
| 2024 | $1,198 | $63,850 | $15,125 | $48,725 |
| 2023 | $1,198 | $63,850 | $15,125 | $48,725 |
| 2022 | $1,032 | $63,850 | $15,125 | $48,725 |
| 2021 | $908 | $40,925 | $8,125 | $32,800 |
| 2020 | $908 | $40,925 | $8,125 | $32,800 |
| 2019 | $908 | $40,925 | $8,125 | $32,800 |
| 2018 | $859 | $40,925 | $0 | $0 |
| 2017 | $690 | $25,750 | $0 | $0 |
| 2016 | $690 | $25,750 | $0 | $0 |
| 2015 | $690 | $25,750 | $0 | $0 |
| 2014 | $640 | $25,750 | $0 | $0 |
| 2013 | -- | $26,200 | $0 | $0 |
Source: Public Records
Map
Nearby Homes
- 670 Baker Rd
- 408 Wheeler Ave
- 595 Glenwood Ave
- 630 Baker Rd
- 421 Hardee Ave
- 712 Stewart Valley Dr
- 0 Old Nashville Hwy
- 2 Old Nashville Hwy
- 0 Baker Rd
- 2110 Alteras Dr
- 1023 Avery Park Dr
- 3000 Everley Ct
- 226 Hamburg Rd
- 809 Stewart Valley Dr
- 320 Longhorn Dr
- 212 Eusa Cantrell Ln
- 1210 MacEy Peri Way
- 1214 Emmie Reece Dr
- 10510 Old Nashville Hwy
- 304 Belgian Ln
- 412 Karstridge Rd
- 404 Karstridge Rd
- 416 Karstridge Rd
- 411 Karstridge Rd
- 200 Glenrose Ln
- 400 Karstridge Rd
- 415 Karstridge Rd
- 424 Karstridge Rd
- 632 Bragg Ave
- 636 Bragg Ave
- 628 Bragg Ave
- 640 Bragg Ave
- 426 Karstridge Rd
- 624 Bragg Ave
- 201 Glenrose Ln
- 644 Bragg Ave
- 204 Glenrose Ln
- 620 Bragg Ave
- 301 Andover Dr