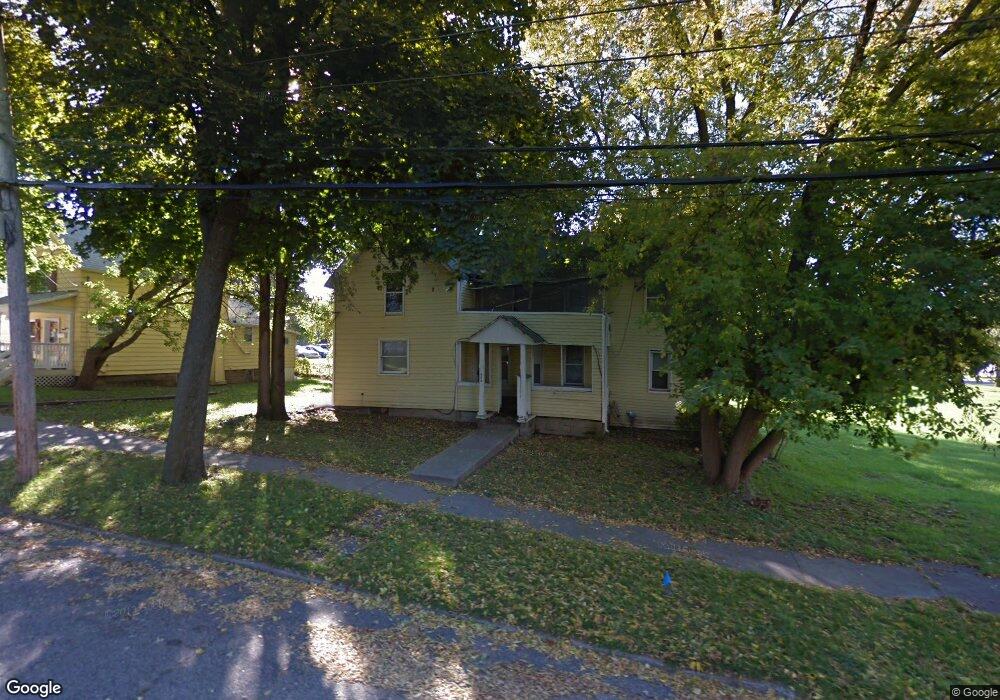
408 Monroe St Unit 1 Lansing, MI 48906
Old Town NeighborhoodEstimated Value: $149,000 - $196,000
Studio
--
Bath
2,380
Sq Ft
$72/Sq Ft
Est. Value
About This Home
This home is located at 408 Monroe St Unit 1, Lansing, MI 48906 and is currently estimated at $170,245, approximately $71 per square foot. 408 Monroe St Unit 1 is a home located in Ingham County with nearby schools including Willow School, Pattengill Academy, and Eastern High School.
Ownership History
Date
Name
Owned For
Owner Type
Purchase Details
Closed on
Nov 30, 2014
Sold by
Rose Acceptance Inc
Bought by
Lccnet Inc
Current Estimated Value
Purchase Details
Closed on
May 9, 2013
Sold by
Md Investment Group Llc
Bought by
Rose Acceptance Inc
Purchase Details
Closed on
Jan 8, 2008
Sold by
Md Real Estate Llc
Bought by
Md Investment Group Llc
Purchase Details
Closed on
Nov 28, 2005
Sold by
Diebolt Mark and Diebolt Mark J
Bought by
Md Real Estate Llc
Home Financials for this Owner
Home Financials are based on the most recent Mortgage that was taken out on this home.
Original Mortgage
$50,000
Interest Rate
6.2%
Mortgage Type
Credit Line Revolving
Purchase Details
Closed on
Jun 17, 2005
Sold by
Butler Fred Claude and Butler Fred C
Bought by
Diebolt Mark
Purchase Details
Closed on
Mar 9, 2002
Sold by
J & E Properties Inc
Bought by
Butler Fred C
Purchase Details
Closed on
Feb 2, 1998
Sold by
Butler Fred C
Bought by
J&E Properties, Inc.
Create a Home Valuation Report for This Property
The Home Valuation Report is an in-depth analysis detailing your home's value as well as a comparison with similar homes in the area
Home Values in the Area
Average Home Value in this Area
Purchase History
| Date | Buyer | Sale Price | Title Company |
|---|---|---|---|
| Lccnet Inc | $15,000 | None Available | |
| Rose Acceptance Inc | $66,000 | None Available | |
| Md Investment Group Llc | -- | None Available | |
| Md Real Estate Llc | -- | Transnation Title | |
| Diebolt Mark | $55,000 | Landamerica Transnation Titl | |
| Butler Fred C | -- | -- | |
| J&E Properties, Inc. | $55,000 | -- |
Source: Public Records
Mortgage History
| Date | Status | Borrower | Loan Amount |
|---|---|---|---|
| Previous Owner | Md Real Estate Llc | $50,000 |
Source: Public Records
Tax History
| Year | Tax Paid | Tax Assessment Tax Assessment Total Assessment is a certain percentage of the fair market value that is determined by local assessors to be the total taxable value of land and additions on the property. | Land | Improvement |
|---|---|---|---|---|
| 2025 | $8,210 | $88,900 | $5,900 | $83,000 |
| 2024 | $65 | $88,200 | $5,900 | $82,300 |
| 2023 | $6,839 | $65,400 | $5,900 | $59,500 |
| 2022 | $3,502 | $59,900 | $4,400 | $55,500 |
| 2021 | $3,903 | $52,200 | $4,700 | $47,500 |
| 2020 | $4,973 | $47,200 | $4,700 | $42,500 |
| 2019 | $6,836 | $44,200 | $4,700 | $39,500 |
| 2018 | $3,460 | $38,000 | $4,700 | $33,300 |
| 2017 | $2,717 | $38,000 | $4,700 | $33,300 |
| 2016 | $4,537 | $32,700 | $4,700 | $28,000 |
| 2015 | $4,537 | $31,500 | $9,405 | $22,095 |
| 2014 | $4,537 | $30,400 | $9,405 | $20,995 |
Source: Public Records
Map
Nearby Homes
- 0 S M 43 Hwy
- 1036 N Larch St
- 1054 N Cedar St
- 908 N Capitol Ave
- 920 N Capitol Ave Unit 1
- 1031 N Washington Ave
- 1 N Grand Ave
- 433 Dorrance Place
- 809 Seymour Ave
- 427 Liberty St
- 925 May St
- 312 W Saginaw St Unit 1
- 110 E Willow St
- 322 Pere Marquette Dr Unit 15
- 309 W Lapeer St
- 908 N Walnut St
- 1023 Seymour Ave
- 612 N Walnut St
- 733 N Walnut St
- 901 E César E Chávez Ave
Your Personal Tour Guide
Ask me questions while you tour the home.