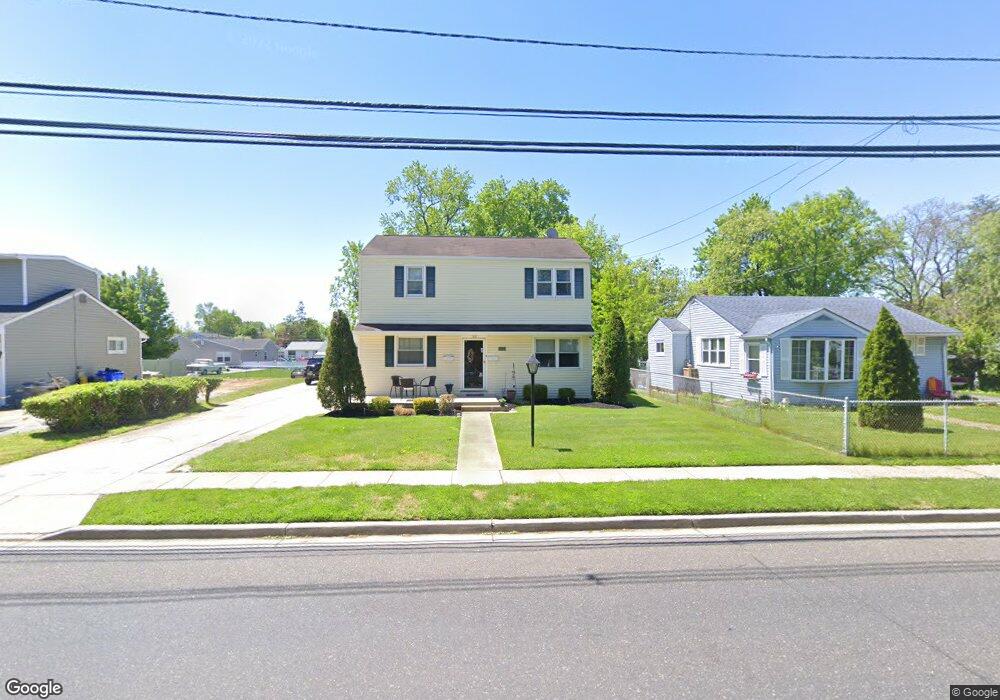
408 N Forklanding Rd Maple Shade, NJ 08052
Estimated Value: $336,921 - $389,000
--
Bed
--
Bath
1,756
Sq Ft
$212/Sq Ft
Est. Value
About This Home
This home is located at 408 N Forklanding Rd, Maple Shade, NJ 08052 and is currently estimated at $371,730, approximately $211 per square foot. 408 N Forklanding Rd is a home located in Burlington County with nearby schools including Ralph J Steinhauer Elementary School, Maude M. Wilkins Elementary School, and Howard R Yocum School.
Ownership History
Date
Name
Owned For
Owner Type
Purchase Details
Closed on
Jun 10, 2022
Sold by
John Freni Jr And Norma C Freni Trust
Bought by
Freni Norma C and Rosario Joann D
Current Estimated Value
Purchase Details
Closed on
Jul 25, 2011
Sold by
Freni John and Freni Norma C
Bought by
Freni John and Freni Norma C
Purchase Details
Closed on
Oct 10, 1995
Sold by
Freni John
Bought by
Freni John and Freni Norma C
Purchase Details
Closed on
Jun 15, 1995
Sold by
Freni John and Freni Norma C
Bought by
John Freni Jr & Norma C Freni Trust
Purchase Details
Closed on
Sep 30, 1993
Sold by
Potts James A
Bought by
Freni John and Frenif Norma
Home Financials for this Owner
Home Financials are based on the most recent Mortgage that was taken out on this home.
Original Mortgage
$67,000
Interest Rate
6.86%
Create a Home Valuation Report for This Property
The Home Valuation Report is an in-depth analysis detailing your home's value as well as a comparison with similar homes in the area
Home Values in the Area
Average Home Value in this Area
Purchase History
| Date | Buyer | Sale Price | Title Company |
|---|---|---|---|
| Freni Norma C | -- | -- | |
| Freni Norma C | -- | None Listed On Document | |
| Freni John | -- | Fidelity Title Abstract Co | |
| Freni John | -- | -- | |
| John Freni Jr & Norma C Freni Trust | -- | -- | |
| Freni John | $95,000 | -- |
Source: Public Records
Mortgage History
| Date | Status | Borrower | Loan Amount |
|---|---|---|---|
| Previous Owner | Freni John | $67,000 |
Source: Public Records
Tax History Compared to Growth
Tax History
| Year | Tax Paid | Tax Assessment Tax Assessment Total Assessment is a certain percentage of the fair market value that is determined by local assessors to be the total taxable value of land and additions on the property. | Land | Improvement |
|---|---|---|---|---|
| 2025 | $7,835 | $206,400 | $43,500 | $162,900 |
| 2024 | $7,608 | $206,400 | $43,500 | $162,900 |
| 2023 | $7,608 | $206,400 | $43,500 | $162,900 |
| 2022 | $7,490 | $206,400 | $43,500 | $162,900 |
| 2021 | $7,418 | $206,400 | $43,500 | $162,900 |
| 2020 | $7,439 | $206,400 | $43,500 | $162,900 |
| 2019 | $7,166 | $206,400 | $43,500 | $162,900 |
| 2018 | $7,042 | $206,400 | $43,500 | $162,900 |
| 2017 | $6,960 | $206,400 | $43,500 | $162,900 |
| 2016 | $6,857 | $206,400 | $43,500 | $162,900 |
| 2015 | $6,708 | $206,400 | $43,500 | $162,900 |
| 2014 | $6,504 | $206,400 | $43,500 | $162,900 |
Source: Public Records
Map
Nearby Homes
- 301 N Coles Ave
- 4 W Germantown Ave
- 12 Collins Ln
- 29 W Broadway
- 505 Greenwood Ave
- 48 N Terrace Ave
- 218 E Germantown Ave
- 41 Orchard Ave
- 22 Theodore Ave
- 480 W Front St
- 104 E Laurelton Ave
- 425 Stiles Ave
- 15 N Poplar Ave
- 124 Stiles Ave
- 524 W Main St
- 431 E Park Ave
- 107 S Forklanding Rd
- 19 Farnsworth Ave
- 112 S Maple Ave
- 8515 Bryn Mawr Ave
- 412 N Forklanding Rd
- 404 N Forklanding Rd
- 400 N Forklanding Rd
- 416 N Forklanding Rd
- 411 Oakland Ave
- 407 Oakland Ave
- 429 N Forklanding Rd
- 420 N Forklanding Rd
- 431 N Forklanding Rd
- 433 N Forklanding Rd
- 403 Oakland Ave
- 419 Oakland Ave
- 3 W Woodlawn Ave
- 7 W Woodlawn Ave
- 439 N Forklanding Rd
- 423 Oakland Ave
- 11 W Woodlawn Ave
- 424 N Forklanding Rd
- 443 N Forklanding Rd
- 15 W Woodlawn Ave