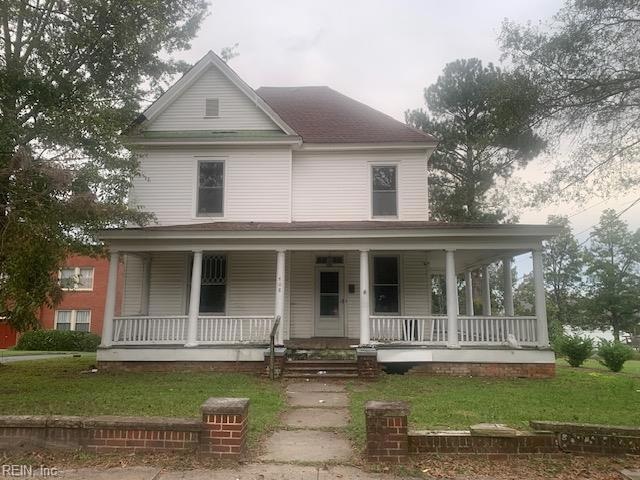
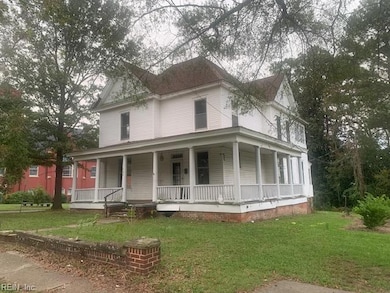
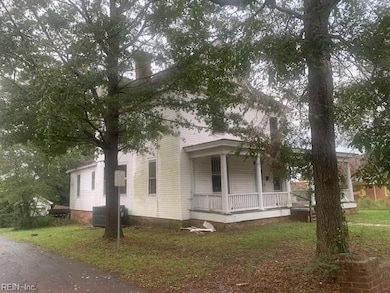
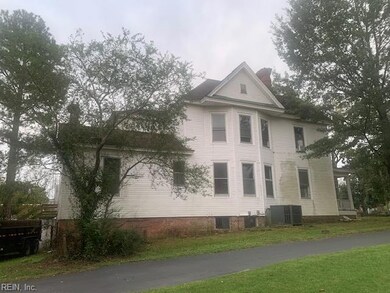
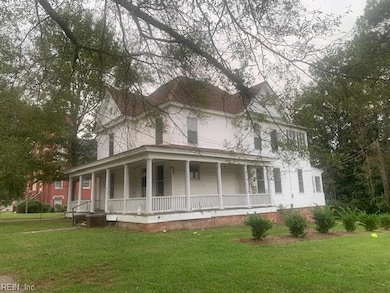
408 N High St Franklin, VA 23851
Estimated payment $910/month
Highlights
- Traditional Architecture
- 1 Fireplace
- Porch
- Wood Flooring
- No HOA
- Central Air
About This Home
Great Investment Opportunity. Lots Of Potential In This 5 Bedroom Property Located In An Area Surrounded By Flips And Rehabs, Perfect For Your Next Project!
Home Details
Home Type
- Single Family
Est. Annual Taxes
- $1,657
Year Built
- Built in 1910
Home Design
- Traditional Architecture
- Metal Roof
- Vinyl Siding
Interior Spaces
- 2,748 Sq Ft Home
- 2-Story Property
- 1 Fireplace
- Crawl Space
- Washer and Dryer Hookup
Flooring
- Wood
- Parquet
- Ceramic Tile
Bedrooms and Bathrooms
- 5 Bedrooms
- 2 Full Bathrooms
Parking
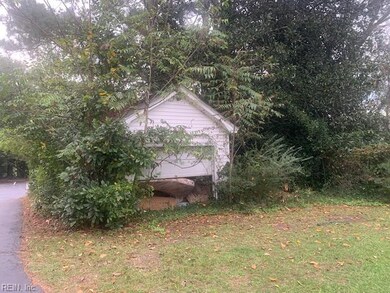
- 1 Car Detached Garage
- Off-Street Parking
Schools
- S.P. Morton Elementary School
- Joseph P. King Jr. Middle School
- Franklin High School
Utilities
- Central Air
- Heat Pump System
- Electric Water Heater
Additional Features
- Porch
- 8,712 Sq Ft Lot
Community Details
- No Home Owners Association
- All Others Area 67 Subdivision
Map
Home Values in the Area
Average Home Value in this Area
Tax History
| Year | Tax Paid | Tax Assessment Tax Assessment Total Assessment is a certain percentage of the fair market value that is determined by local assessors to be the total taxable value of land and additions on the property. | Land | Improvement |
|---|---|---|---|---|
| 2025 | $1,657 | $160,900 | $28,000 | $132,900 |
| 2024 | -- | $160,900 | $28,000 | $132,900 |
| 2023 | $1,280 | $124,300 | $20,200 | $104,100 |
| 2022 | $1,280 | $124,300 | $20,200 | $104,100 |
| 2021 | $1,085 | $105,300 | $18,400 | $86,900 |
| 2020 | $941 | $105,300 | $18,400 | $86,900 |
| 2019 | $941 | $95,100 | $18,400 | $76,700 |
| 2018 | $941 | $95,100 | $18,400 | $76,700 |
| 2017 | $896 | $90,500 | $17,500 | $73,000 |
| 2016 | $896 | $90,500 | $17,500 | $73,000 |
| 2015 | -- | $0 | $0 | $0 |
| 2014 | -- | $0 | $0 | $0 |
| 2013 | -- | $0 | $0 | $0 |
Property History
| Date | Event | Price | List to Sale | Price per Sq Ft |
|---|---|---|---|---|
| 01/16/2026 01/16/26 | Pending | -- | -- | -- |
| 10/01/2025 10/01/25 | For Sale | $150,000 | -- | $55 / Sq Ft |
Purchase History
| Date | Type | Sale Price | Title Company |
|---|---|---|---|
| Warranty Deed | $31,900 | -- | |
| Trustee Deed | $81,000 | -- | |
| Warranty Deed | $119,500 | -- |
Mortgage History
| Date | Status | Loan Amount | Loan Type |
|---|---|---|---|
| Previous Owner | $119,500 | New Conventional |
Source: Real Estate Information Network (REIN)
MLS Number: 10604279
APN: 106-04814-48
Disclaimer: Certain information contained herein is derived from information provided by parties other than Homes.com. All information provided is deemed reliable, but is not guaranteed to be accurate and should be independently verified.
![]() The listings data displayed on this medium comes in part from the Real Estate Information Network, Inc. (REIN) and has been authorized by participating listing Broker Members of REIN for display. REIN's listings are based upon Data submitted by its Broker Members, and REIN therefore makes no representation or warranty regarding the accuracy of the Data. All users of REIN's listings database should confirm the accuracy of the listing information directly with the listing agent.
The listings data displayed on this medium comes in part from the Real Estate Information Network, Inc. (REIN) and has been authorized by participating listing Broker Members of REIN for display. REIN's listings are based upon Data submitted by its Broker Members, and REIN therefore makes no representation or warranty regarding the accuracy of the Data. All users of REIN's listings database should confirm the accuracy of the listing information directly with the listing agent.
Copyright 2026 REIN. REIN's listings Data and information is protected under federal copyright laws. Federal law prohibits, among other acts, the unauthorized copying or alteration of, or preparation of derivative works from, all or any part of copyrighted materials, including certain compilations of Data and information. COPYRIGHT VIOLATORS MAY BE SUBJECT TO SEVERE FINES AND PENALTIES UNDER FEDERAL LAW.
REIN updates its listings on a daily basis.
Some listings may be duplicated in the search results due to the co-mingling of listings from more than one multiple listing service. Should there be different listing information between the duplicated listings; user is advised to verify the accuracy of the listing information before making any financial decisions.
Some or all of the listings (or listings Data) represented in this application have been enhanced with Data not provided by REIN. The enhancements are as follows: mapping, demographics, and economics. The source of these enhancements are: GreatSchools, CoStar, Google, Walk Score, How Loud, Collateral Analytics, Black Knight, First American, and Quantarium.
This application does not include information on all of the properties available for sale at this time.

Ask me questions while you tour the home.