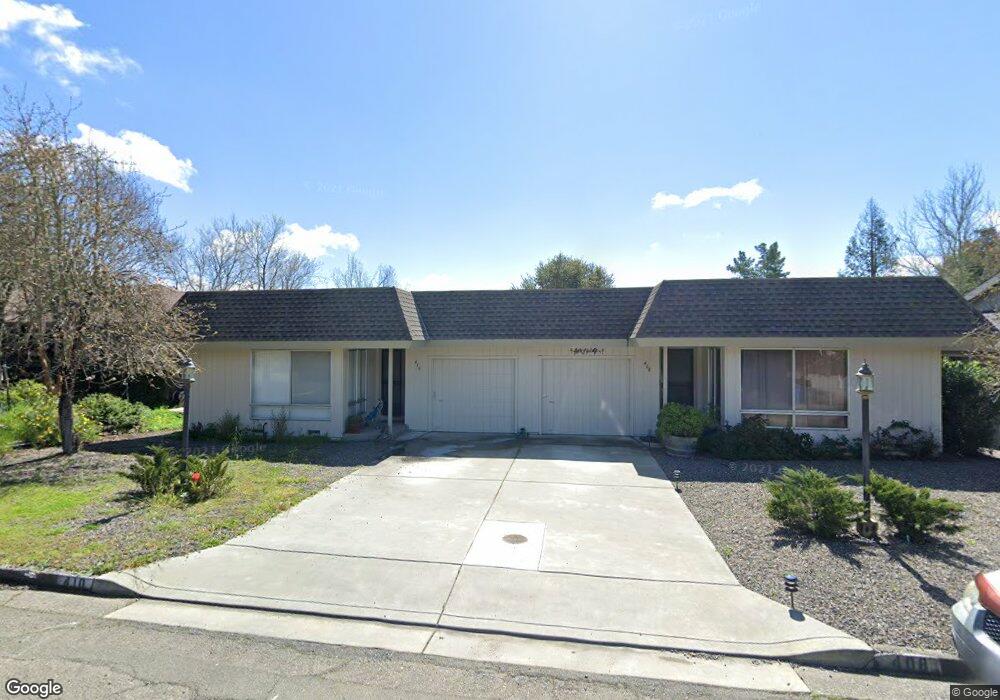
408 Pheasant Ln Santa Rosa, CA 95403
Estimated Value: $747,000 - $1,070,042
4
Beds
3
Baths
2,592
Sq Ft
$336/Sq Ft
Est. Value
About This Home
This home is located at 408 Pheasant Ln, Santa Rosa, CA 95403 and is currently estimated at $870,011, approximately $335 per square foot. 408 Pheasant Ln is a home located in Sonoma County with nearby schools including Santa Rosa Middle School, Santa Rosa High School, and San Miguel Elementary School.
Ownership History
Date
Name
Owned For
Owner Type
Purchase Details
Closed on
Oct 11, 2019
Sold by
Wallace John C and Wallace Family Trust
Bought by
Clark Wallace John C and Clark Wallace Dean
Current Estimated Value
Purchase Details
Closed on
Aug 21, 2002
Sold by
Wallace John C and Wallace Deanna J
Bought by
Wallace John C and Wallace Deanna J
Home Financials for this Owner
Home Financials are based on the most recent Mortgage that was taken out on this home.
Original Mortgage
$231,900
Interest Rate
6.51%
Purchase Details
Closed on
Aug 13, 2002
Sold by
Wallace John C and Wallace Deanna J
Bought by
Wallace John C and Wallace Deanna J
Home Financials for this Owner
Home Financials are based on the most recent Mortgage that was taken out on this home.
Original Mortgage
$231,900
Interest Rate
6.51%
Purchase Details
Closed on
Nov 24, 1999
Sold by
Wallace John C and Wallace Deanna J
Bought by
Wallace John C and Wallace Deanna J
Purchase Details
Closed on
Jul 10, 1996
Sold by
T G Super Exchange Corp
Bought by
Fitzgerald Brian and Fitzgerald Rochell
Home Financials for this Owner
Home Financials are based on the most recent Mortgage that was taken out on this home.
Original Mortgage
$170,000
Interest Rate
8.3%
Create a Home Valuation Report for This Property
The Home Valuation Report is an in-depth analysis detailing your home's value as well as a comparison with similar homes in the area
Home Values in the Area
Average Home Value in this Area
Purchase History
| Date | Buyer | Sale Price | Title Company |
|---|---|---|---|
| Clark Wallace John C | -- | None Available | |
| Wallace John C | -- | Chicago Title Co | |
| Wallace John C | -- | Chicago Title Co | |
| Wallace John C | -- | North American Title Co | |
| Fitzgerald Brian | $262,000 | Fidelity National Title Co | |
| T G Super Exchange Corp | -- | Fidelity National Title Co |
Source: Public Records
Mortgage History
| Date | Status | Borrower | Loan Amount |
|---|---|---|---|
| Previous Owner | Wallace John C | $231,900 | |
| Previous Owner | Fitzgerald Brian | $170,000 |
Source: Public Records
Tax History
| Year | Tax Paid | Tax Assessment Tax Assessment Total Assessment is a certain percentage of the fair market value that is determined by local assessors to be the total taxable value of land and additions on the property. | Land | Improvement |
|---|---|---|---|---|
| 2025 | $7,529 | $856,800 | $285,600 | $571,200 |
| 2024 | $7,529 | $438,482 | $150,678 | $287,804 |
| 2023 | $7,529 | $429,885 | $147,724 | $282,161 |
| 2022 | $6,895 | $421,457 | $144,828 | $276,629 |
| 2021 | $6,651 | $413,194 | $141,989 | $271,205 |
| 2020 | $6,565 | $408,959 | $140,534 | $268,425 |
| 2019 | $6,448 | $400,941 | $137,779 | $263,162 |
| 2018 | $6,071 | $393,080 | $135,078 | $258,002 |
| 2017 | $0 | $385,374 | $132,430 | $252,944 |
| 2016 | $5,801 | $377,819 | $129,834 | $247,985 |
| 2015 | -- | $372,145 | $127,884 | $244,261 |
| 2014 | -- | $364,856 | $125,379 | $239,477 |
Source: Public Records
Map
Nearby Homes
- 5270 El Mercado Pkwy
- 446 Las Casitas Unit D
- 442 Las Casitas Ct Unit A
- 442 Las Casitas Ct Unit B
- 384 Mark West Commons Cir
- 5525 Carriage Ln
- 1335 Wikiup Dr
- 5262 Wikiup Ct
- 4980 Carriage Ln
- 2543 Courtney Ave
- 5309 Old Redwood Hwy
- 573 Misty Ct
- 5440 Corbett Cir
- 1064 Wikiup Dr
- 5640 Corbett Cir
- 5537 Corbett Cir
- 1058 Wikiup Dr
- 5300 Rexford Way
- 5210 Fulton Rd
- 5159 Vista Grande Dr
- 412 Pheasant Ln
- 406 Pheasant Ln
- 417 Pheasant Ln
- 413 Pheasant Ln
- 402 Pheasant Ln
- 416 Pheasant Ln
- 415 Pheasant Ln
- 421 Pheasant Ln
- 425 Pheasant Ln
- 313 Wikiup Dr
- 435 Pheasant Ln
- 309 Wikiup Dr
- 409 Pheasant Ln
- 439 Pheasant Ln
- 427 Pheasant Ln
- 411 Pheasant Ln
- 403 Pheasant Ln
- 401 Pheasant Ln
- 407 Pheasant Ln
- 431 Pheasant Ln
Your Personal Tour Guide
Ask me questions while you tour the home.