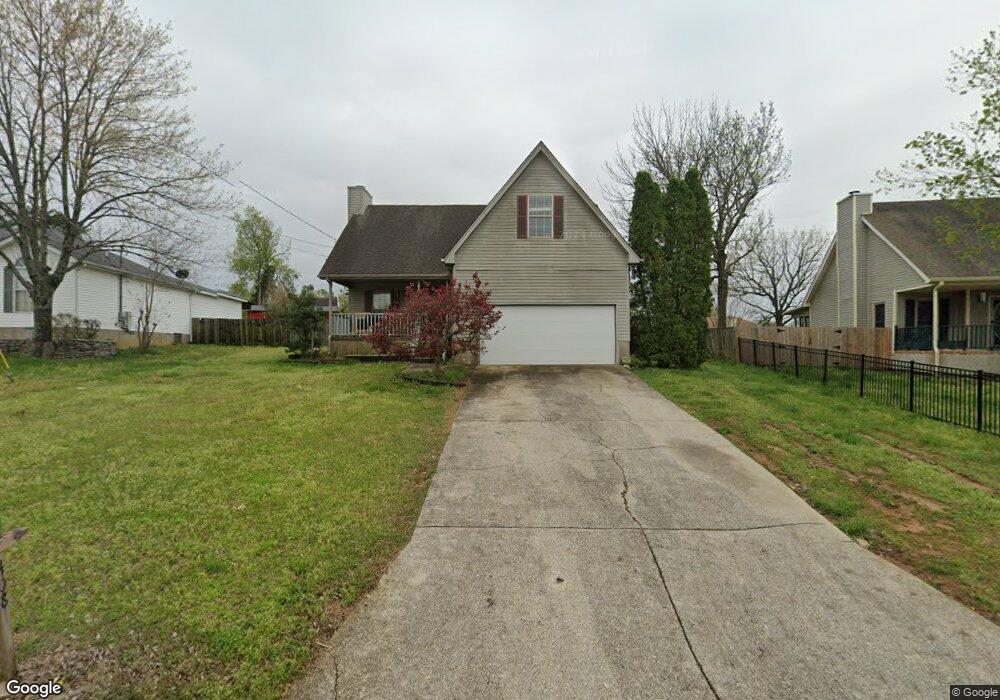
408 Randall Ln La Vergne, TN 37086
Estimated Value: $322,253 - $377,000
--
Bed
3
Baths
1,658
Sq Ft
$218/Sq Ft
Est. Value
About This Home
This home is located at 408 Randall Ln, La Vergne, TN 37086 and is currently estimated at $360,813, approximately $217 per square foot. 408 Randall Ln is a home located in Rutherford County with nearby schools including LaVergne Lake Elementary School, La Vergne Middle School, and Lavergne High School.
Ownership History
Date
Name
Owned For
Owner Type
Purchase Details
Closed on
Jul 13, 2007
Sold by
Strauser Jeffrey C
Bought by
Keene Joshua D
Current Estimated Value
Home Financials for this Owner
Home Financials are based on the most recent Mortgage that was taken out on this home.
Original Mortgage
$146,975
Outstanding Balance
$92,867
Interest Rate
6.71%
Mortgage Type
Purchase Money Mortgage
Estimated Equity
$267,946
Purchase Details
Closed on
Apr 25, 2002
Sold by
Blood and Rosa
Bought by
Strauser Jeffrey C
Home Financials for this Owner
Home Financials are based on the most recent Mortgage that was taken out on this home.
Original Mortgage
$135,960
Interest Rate
7.18%
Purchase Details
Closed on
Oct 27, 1997
Sold by
Blanchard Sheila J
Bought by
H U D
Purchase Details
Closed on
Oct 9, 1996
Sold by
Blanchard Donald E
Bought by
Blanchard Sheila J
Purchase Details
Closed on
Apr 5, 1995
Sold by
Holigan Homes Inc
Bought by
Blanchard Donald E
Purchase Details
Closed on
Dec 15, 1994
Sold by
Holigan Family Investments
Bought by
Holigan Homes Inc
Create a Home Valuation Report for This Property
The Home Valuation Report is an in-depth analysis detailing your home's value as well as a comparison with similar homes in the area
Home Values in the Area
Average Home Value in this Area
Purchase History
| Date | Buyer | Sale Price | Title Company |
|---|---|---|---|
| Keene Joshua D | $149,900 | -- | |
| Strauser Jeffrey C | $132,000 | -- | |
| H U D | $107,966 | -- | |
| Blanchard Sheila J | -- | -- | |
| Blanchard Donald E | $106,285 | -- | |
| Holigan Homes Inc | -- | -- |
Source: Public Records
Mortgage History
| Date | Status | Borrower | Loan Amount |
|---|---|---|---|
| Open | Holigan Homes Inc | $146,975 | |
| Previous Owner | Holigan Homes Inc | $135,960 |
Source: Public Records
Tax History Compared to Growth
Tax History
| Year | Tax Paid | Tax Assessment Tax Assessment Total Assessment is a certain percentage of the fair market value that is determined by local assessors to be the total taxable value of land and additions on the property. | Land | Improvement |
|---|---|---|---|---|
| 2025 | $1,736 | $71,950 | $13,750 | $58,200 |
| 2024 | $1,736 | $71,950 | $13,750 | $58,200 |
| 2023 | $1,350 | $71,950 | $13,750 | $58,200 |
| 2022 | $1,163 | $71,950 | $13,750 | $58,200 |
| 2021 | $1,096 | $49,400 | $10,000 | $39,400 |
| 2020 | $1,096 | $49,400 | $10,000 | $39,400 |
| 2019 | $1,096 | $49,400 | $10,000 | $39,400 |
| 2018 | $1,388 | $49,400 | $0 | $0 |
| 2017 | $1,104 | $30,400 | $0 | $0 |
| 2016 | $1,104 | $30,400 | $0 | $0 |
| 2015 | $1,111 | $30,400 | $0 | $0 |
| 2014 | $756 | $30,400 | $0 | $0 |
| 2013 | -- | $31,925 | $0 | $0 |
Source: Public Records
Map
Nearby Homes
- 607 Mable Dr
- 396 Davids Way
- 1529 Waxman Dr
- 507 Jerald Smith Ln
- 800 Troy Cove
- 1610 Jo Ann Dr
- 1710 Chris Dr
- 1626 Jo Ann Dr
- 166 Oasis Dr
- 160 Oasis Dr
- 164 Oasis Dr
- 154 Oasis Dr
- 1813 Rory Cove
- 733 Hollandale Rd
- 303 Holland Ridge Dr
- 618 Cedar Bend Ln
- 1721 Jimmy Cove
- 101 Kalman Minuskin Blvd
- 699 Hollandale Rd
- 303 Amit St
- 410 Randall Ln
- 406 Randall Ln
- 418 Lake Forest Dr
- 416 Lake Forest Dr
- 412 Randall Ln
- 420 Lake Forest Dr
- 404 Randall Ln
- 414 Lake Forest Dr
- 407 Randall Ln
- 422 Lake Forest Dr
- 409 Randall Ln
- 405 Randall Ln
- 414 Randall Ln
- 402 Randall Ln
- 411 Randall Ln
- 412 Lake Forest Dr
- 424 Lake Forest Dr
- 403 Randall Ln
- 413 Randall Ln
- 416 Randall Ln