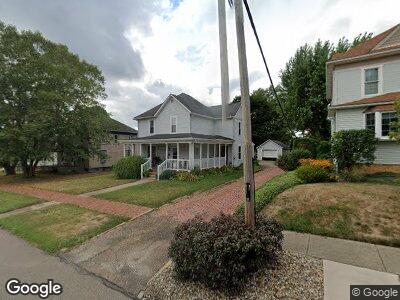
408 S Lisbon St Unit 3A Carrollton, OH 44615
Carrollton NeighborhoodEstimated Value: $120,000 - $154,176
3
Beds
2
Baths
1,552
Sq Ft
$87/Sq Ft
Est. Value
About This Home
This home is located at 408 S Lisbon St Unit 3A, Carrollton, OH 44615 and is currently estimated at $134,794, approximately $86 per square foot. 408 S Lisbon St Unit 3A is a home located in Carroll County with nearby schools including Carrollton High School and Carroll County Christian Academy.
Ownership History
Date
Name
Owned For
Owner Type
Purchase Details
Closed on
Sep 12, 2016
Sold by
Yingling Nicholas and Yingling Loretta
Bought by
Jo Davisson Candy
Current Estimated Value
Purchase Details
Closed on
Mar 25, 2011
Sold by
Federal Home Loan Mortgage Corporation
Bought by
Yingling Nicholas and Yingling Loretta
Purchase Details
Closed on
Mar 4, 2011
Sold by
Lunsford Becky M
Bought by
Federal Home Loan Mortgage Corp
Purchase Details
Closed on
Jan 4, 2007
Sold by
Citimortgage Inc
Bought by
Lunsford Becky M
Home Financials for this Owner
Home Financials are based on the most recent Mortgage that was taken out on this home.
Original Mortgage
$46,500
Interest Rate
6.19%
Mortgage Type
New Conventional
Purchase Details
Closed on
Mar 3, 2006
Sold by
Meek Shane A and Meek Anita N
Bought by
Citifinancial Mortgage Company Inc
Create a Home Valuation Report for This Property
The Home Valuation Report is an in-depth analysis detailing your home's value as well as a comparison with similar homes in the area
Home Values in the Area
Average Home Value in this Area
Purchase History
| Date | Buyer | Sale Price | Title Company |
|---|---|---|---|
| Jo Davisson Candy | -- | None Available | |
| Yingling Nicholas | $27,900 | None Available | |
| Federal Home Loan Mortgage Corp | $30,000 | None Available | |
| Lunsford Becky M | $46,500 | None Available | |
| Citifinancial Mortgage Company Inc | -- | None Available |
Source: Public Records
Mortgage History
| Date | Status | Borrower | Loan Amount |
|---|---|---|---|
| Previous Owner | Luneford Becky M | $62,000 | |
| Previous Owner | Lunsford Becky M | $46,500 |
Source: Public Records
Tax History Compared to Growth
Tax History
| Year | Tax Paid | Tax Assessment Tax Assessment Total Assessment is a certain percentage of the fair market value that is determined by local assessors to be the total taxable value of land and additions on the property. | Land | Improvement |
|---|---|---|---|---|
| 2024 | $1,452 | $41,480 | $5,950 | $35,530 |
| 2023 | $1,443 | $41,480 | $5,950 | $35,530 |
| 2022 | $1,435 | $34,290 | $4,940 | $29,350 |
| 2021 | $1,227 | $34,290 | $4,940 | $29,350 |
| 2020 | $1,167 | $34,290 | $4,940 | $29,350 |
| 2019 | $1,177 | $34,283 | $4,935 | $29,348 |
| 2018 | $933 | $26,070 | $3,780 | $22,290 |
| 2017 | $873 | $26,070 | $3,780 | $22,290 |
| 2016 | $786 | $23,920 | $3,470 | $20,450 |
| 2015 | $786 | $23,920 | $3,470 | $20,450 |
| 2014 | $786 | $23,920 | $3,470 | $20,450 |
| 2013 | $779 | $23,920 | $3,470 | $20,450 |
Source: Public Records
Map
Nearby Homes
- 208 2nd St SW Unit 5
- 124 2nd St NE Unit 12A
- 0 Moody Ave SW
- 289 2nd St NW Unit 26
- 219 2nd St NE Unit 6
- 345 E Main St Unit 3
- 396 2nd St NE Unit 6
- 427 N Lisbon St Unit 9
- 428 High St NW Unit 32
- 400 Park Ave NE
- 0 Steubenville Rd SE Unit 5104751
- 0 Steubenville Rd SE Unit 5092631
- 615 Longhorn St NW Unit 20B
- 41 Wood Rd SE
- 3525 Roswell Rd SW
- 0 Roswell Rd SW
- 112 12th St NW
- 1175 Lindy Ln NW
- 1250 Alamo Rd SE
- 459 Buck Rd NW
- 408 S Lisbon St Unit 3A
- 416 S Lisbon St Unit 3A
- 398 S Lisbon St Unit 3A
- 388 S Lisbon St Unit 1A
- 422 S Lisbon St Unit 3A
- 411 S Lisbon St Unit 41
- 378 S Lisbon St Unit 3A
- 409 High St SW Unit 3A
- 393 S Lisbon St Unit 41
- 368 S Lisbon St Unit 3A
- 24 4th St SE Unit 41
- 434 S Lisbon St Unit 3A
- 77 3rd St SW
- 429 S Lisbon St Unit 43
- 356 S Lisbon St Unit 3A
- 383 S Lisbon St Unit 41
- 42 4th St SE Unit 41
- 433 S Lisbon St Unit 43
- 348 S Lisbon St Unit 16
- 367 S Lisbon St Unit 369