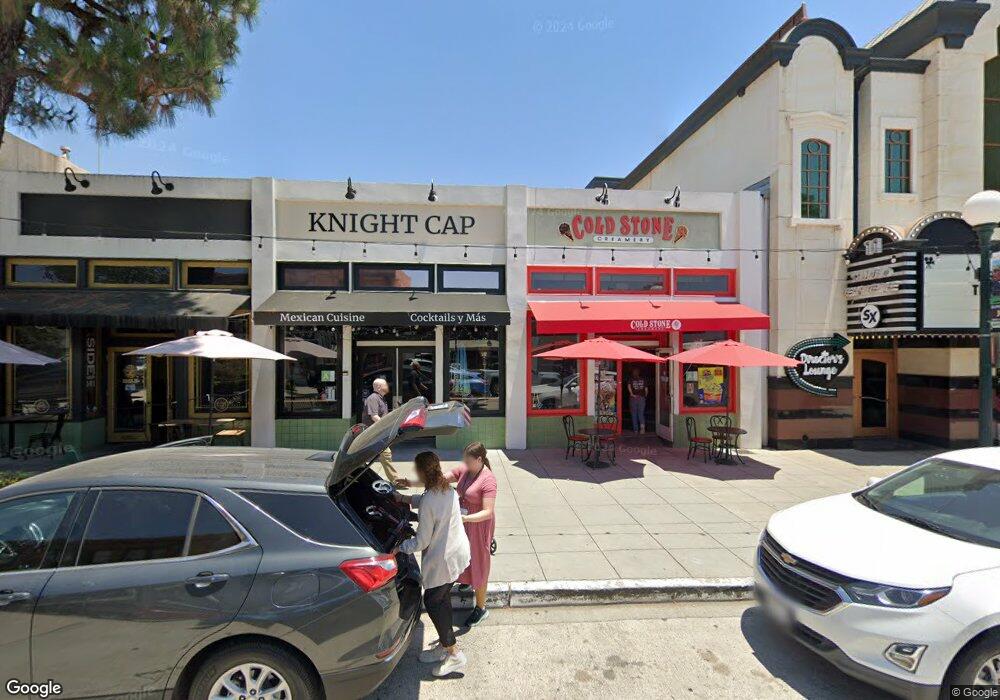
408 S Myrtle Ave Monrovia, CA 91016
Studio
--
Bath
59,641
Sq Ft
6,403
Sq Ft Lot Lot
About This Home
This home is located at 408 S Myrtle Ave, Monrovia, CA 91016. 408 S Myrtle Ave is a home located in Los Angeles County with nearby schools including Mayflower Elementary School, Clifton Middle School, and Monrovia High School.
Ownership History
Date
Name
Owned For
Owner Type
Purchase Details
Closed on
Sep 30, 2015
Sold by
Showprop Monrovia Llc
Bought by
Spirit Master Funding X Llc
Purchase Details
Closed on
Sep 25, 1998
Sold by
Lustig Jane
Bought by
Showprop Monrovia Llc
Home Financials for this Owner
Home Financials are based on the most recent Mortgage that was taken out on this home.
Original Mortgage
$500,000
Interest Rate
6.6%
Mortgage Type
Commercial
Purchase Details
Closed on
Oct 6, 1997
Sold by
Sandford Jules
Bought by
Lustig Jane
Home Financials for this Owner
Home Financials are based on the most recent Mortgage that was taken out on this home.
Original Mortgage
$460,000
Interest Rate
7.49%
Mortgage Type
Seller Take Back
Purchase Details
Closed on
Mar 13, 1997
Sold by
Trypucko John
Bought by
Sandford Jules and Young Zigfried
Purchase Details
Closed on
Nov 14, 1996
Sold by
Sandford Betty
Bought by
Sandford Jules
Create a Home Valuation Report for This Property
The Home Valuation Report is an in-depth analysis detailing your home's value as well as a comparison with similar homes in the area
Home Values in the Area
Average Home Value in this Area
Purchase History
We collect this data history from publicly available records. To have your information removed, we recommend requesting removal directly through your county’s website.
| Date | Buyer | Sale Price | Title Company |
|---|---|---|---|
| Spirit Master Funding X Llc | $18,790,500 | First American Title | |
| Showprop Monrovia Llc | $700,000 | First American | |
| Lustig Jane | $350,000 | -- | |
| Sandford Jules | $270,000 | United Title Company | |
| Sandford Jules | -- | United Title Company |
Source: Public Records
Mortgage History
We collect this data history from publicly available records. To have your information removed, we recommend requesting removal directly through your county’s website.
| Date | Status | Borrower | Loan Amount |
|---|---|---|---|
| Previous Owner | Showprop Monrovia Llc | $500,000 | |
| Previous Owner | Lustig Jane | $460,000 |
Source: Public Records
Tax History
| Year | Tax Paid | Tax Assessment Tax Assessment Total Assessment is a certain percentage of the fair market value that is determined by local assessors to be the total taxable value of land and additions on the property. | Land | Improvement |
|---|---|---|---|---|
| 2025 | $49,092 | $3,339,525 | $438,062 | $2,901,463 |
| 2024 | $47,297 | $3,274,045 | $429,473 | $2,844,572 |
| 2023 | $46,005 | $3,209,849 | $421,052 | $2,788,797 |
| 2022 | $44,700 | $3,146,912 | $412,797 | $2,734,115 |
| 2021 | $43,489 | $3,085,208 | $404,703 | $2,680,505 |
| 2020 | $42,161 | $3,053,574 | $400,554 | $2,653,020 |
| 2019 | $41,445 | $2,992,605 | $392,646 | $2,599,959 |
| 2018 | $40,974 | $2,933,928 | $384,948 | $2,548,980 |
| 2016 | $38,718 | $2,820,000 | $370,000 | $2,450,000 |
| 2015 | $27,088 | $1,900,000 | $195,000 | $1,705,000 |
| 2014 | $26,417 | $1,816,130 | $190,000 | $1,626,130 |
Source: Public Records
Map
Nearby Homes
- 210 W Lime Ave
- 211 Linwood Ave Unit C
- 239 W Palm Ave
- 267 Linwood Ave Unit E
- 137 N Myrtle Ave
- 111 Poinsettia Ave
- 340 W Lime Ave
- 709 S Magnolia Ave
- 134 Melrose Ave
- 418 E Olive Ave
- 526 E Olive Ave Unit A
- 250 N Primrose Ave
- 516 Linwood Ave
- 430 W Walnut Ave
- 307 #1 Melrose Ave
- 319 N Encinitas Ave
- 214 Violet Ave Unit F
- 307 Melrose Ave
- 148 W Cherry Ave
- 128 Los Angeles Ave
- 324 S Myrtle Ave
- 346 S Myrtle Ave
- 314 S Myrtle Ave
- 326 S Myrtle Ave
- 402 S Myrtle Ave Unit 404
- 406 S Myrtle Ave
- 401 S Myrtle Ave
- 432 S Myrtle Ave
- 422 S Myrtle Ave
- 405 S Myrtle Ave
- 423 S Myrtle Ave
- 415 S Myrtle Ave
- 415 S Myrtle Ave Unit B and C
- 139 E Lime Ave
- 417 S Myrtle Ave
- 114 W Lime Ave Unit 1/2
- 114 W Lime Ave Unit 120
- 114 W Lime Ave
- 420 S Myrtle Ave
- 420 S Myrtle Ave Unit C
Your Personal Tour Guide
Ask me questions while you tour the home.