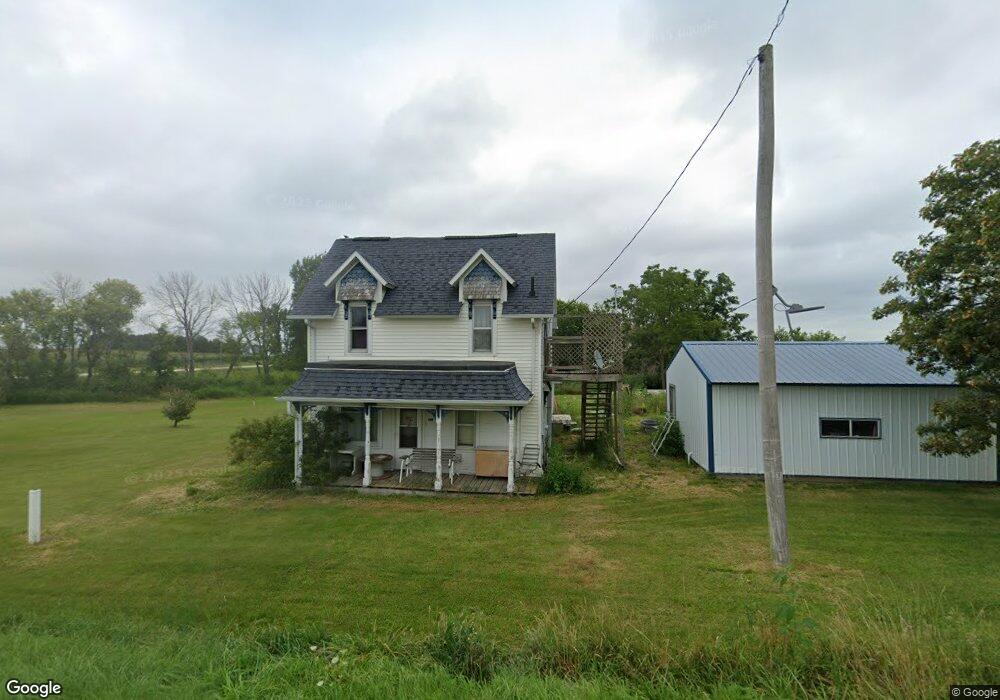
408 Union St Aurora, IA 50607
Estimated Value: $103,000 - $206,108
3
Beds
2
Baths
1,850
Sq Ft
$81/Sq Ft
Est. Value
About This Home
This home is located at 408 Union St, Aurora, IA 50607 and is currently estimated at $150,277, approximately $81 per square foot. 408 Union St is a home located in Buchanan County with nearby schools including East Buchanan Elementary School, East Buchanan Middle School, and East Buchanan High School.
Ownership History
Date
Name
Owned For
Owner Type
Purchase Details
Closed on
Sep 27, 2013
Sold by
Tate Ruth F
Bought by
Leisinger Matthew J and Leisinger Aimee M
Current Estimated Value
Home Financials for this Owner
Home Financials are based on the most recent Mortgage that was taken out on this home.
Original Mortgage
$60,700
Outstanding Balance
$45,416
Interest Rate
4.39%
Mortgage Type
New Conventional
Estimated Equity
$104,861
Purchase Details
Closed on
Jan 23, 2007
Sold by
Sharar Mark E and Sharar Amy J
Bought by
Tate Ruth F
Create a Home Valuation Report for This Property
The Home Valuation Report is an in-depth analysis detailing your home's value as well as a comparison with similar homes in the area
Home Values in the Area
Average Home Value in this Area
Purchase History
| Date | Buyer | Sale Price | Title Company |
|---|---|---|---|
| Leisinger Matthew J | $60,000 | None Available | |
| Tate Ruth F | $72,500 | None Available |
Source: Public Records
Mortgage History
| Date | Status | Borrower | Loan Amount |
|---|---|---|---|
| Open | Leisinger Matthew J | $60,700 |
Source: Public Records
Tax History Compared to Growth
Tax History
| Year | Tax Paid | Tax Assessment Tax Assessment Total Assessment is a certain percentage of the fair market value that is determined by local assessors to be the total taxable value of land and additions on the property. | Land | Improvement |
|---|---|---|---|---|
| 2025 | $1,700 | $114,650 | $10,450 | $104,200 |
| 2024 | $1,700 | $99,140 | $10,450 | $88,690 |
| 2023 | $1,638 | $99,140 | $10,450 | $88,690 |
| 2022 | $1,462 | $82,010 | $10,450 | $71,560 |
| 2021 | $1,448 | $82,010 | $10,450 | $71,560 |
| 2020 | $1,448 | $76,680 | $10,450 | $66,230 |
| 2019 | $1,272 | $76,680 | $10,450 | $66,230 |
| 2018 | $1,204 | $68,330 | $10,450 | $57,880 |
| 2017 | $1,372 | $68,330 | $10,450 | $57,880 |
| 2016 | $1,302 | $75,680 | $12,440 | $63,240 |
| 2015 | $1,302 | $75,680 | $12,440 | $63,240 |
| 2014 | $1,308 | $75,680 | $12,440 | $63,240 |
Source: Public Records
Map
Nearby Homes
- 930 Pearl St
- 2893 160th St
- 3452 B Ave
- 1835 Slater Ave
- 1657 Nathan Bethel Ave
- 1829 Washburn Ave
- 1657 Nathen Bethel Ave
- 104 Monroe St S
- 106 Madison St S
- 207 1st St N
- 1894 105th St
- 1871-8 105th St
- 1871-4 105th St
- 1871-5 105th St
- 1871-3 105th St
- 1871-1 105th St
- 1213 Elm St
- 817 7th St SE
- 108 S Center St
- 5 Hillside Dr E