408 W 6th St Vinton, IA 52349
Estimated Value: $158,100 - $193,000
6
Beds
3
Baths
3,248
Sq Ft
$54/Sq Ft
Est. Value
About This Home
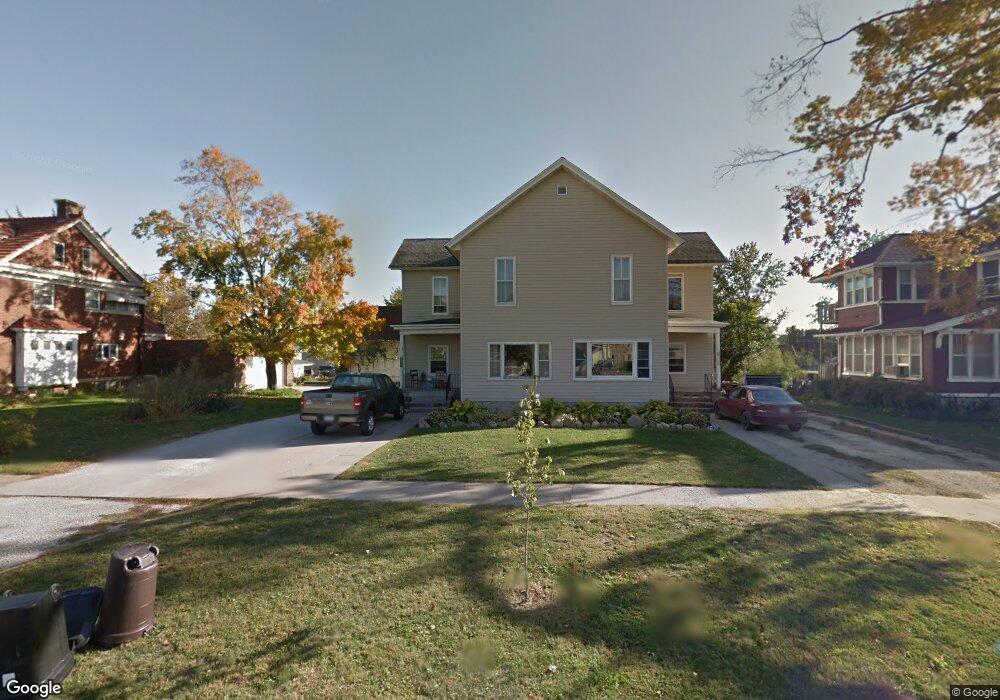
This home is located at 408 W 6th St, Vinton, IA 52349 and is currently estimated at $176,275, approximately $54 per square foot. 408 W 6th St is a home located in Benton County with nearby schools including Tilford Elementary School, Shellsburg Elementary School, and Vinton-Shellsburg Middle School.
Ownership History
Date
Name
Owned For
Owner Type
Purchase Details
Closed on
May 18, 2005
Sold by
Egge Trust
Bought by
Yenser Dawn M and Yenser Douglas A
Current Estimated Value
Home Financials for this Owner
Home Financials are based on the most recent Mortgage that was taken out on this home.
Original Mortgage
$73,695
Outstanding Balance
$43,124
Interest Rate
7.8%
Mortgage Type
Adjustable Rate Mortgage/ARM
Estimated Equity
$133,151
Create a Home Valuation Report for This Property
The Home Valuation Report is an in-depth analysis detailing your home's value as well as a comparison with similar homes in the area
Home Values in the Area
Average Home Value in this Area
Purchase History
| Date | Buyer | Sale Price | Title Company |
|---|---|---|---|
| Yenser Dawn M | $50,000 | None Available |
Source: Public Records
Mortgage History
| Date | Status | Borrower | Loan Amount |
|---|---|---|---|
| Open | Yenser Dawn M | $73,695 |
Source: Public Records
Tax History Compared to Growth
Tax History
| Year | Tax Paid | Tax Assessment Tax Assessment Total Assessment is a certain percentage of the fair market value that is determined by local assessors to be the total taxable value of land and additions on the property. | Land | Improvement |
|---|---|---|---|---|
| 2025 | $2,370 | $150,100 | $15,800 | $134,300 |
| 2024 | $2,370 | $136,700 | $15,800 | $120,900 |
| 2023 | $2,326 | $136,700 | $15,800 | $120,900 |
| 2022 | $2,386 | $117,000 | $12,600 | $104,400 |
| 2021 | $2,386 | $117,000 | $12,600 | $104,400 |
| 2020 | $1,956 | $99,200 | $13,900 | $85,300 |
| 2019 | $1,828 | $99,200 | $13,900 | $85,300 |
| 2018 | $1,772 | $91,900 | $13,500 | $78,400 |
| 2017 | $1,772 | $91,900 | $13,500 | $78,400 |
| 2016 | $1,666 | $85,900 | $12,600 | $73,300 |
| 2015 | $1,666 | $85,900 | $12,600 | $73,300 |
| 2014 | $1,602 | $82,900 | $0 | $0 |
Source: Public Records
Map
Nearby Homes