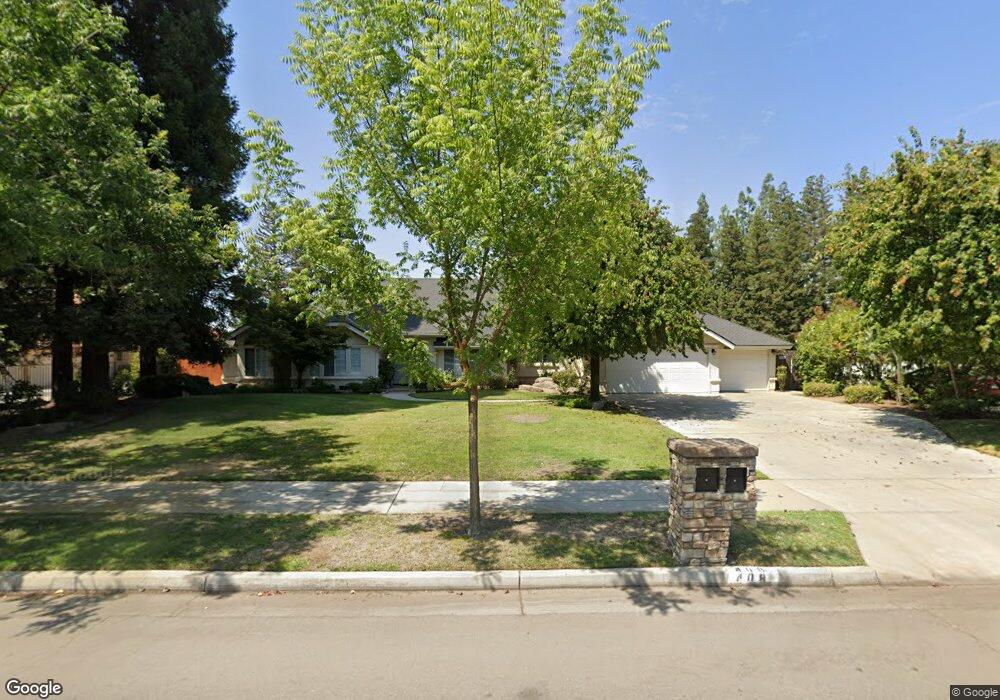
408 W Audubon Dr Fresno, CA 93711
Bullard NeighborhoodEstimated Value: $705,000 - $818,000
4
Beds
4
Baths
2,993
Sq Ft
$255/Sq Ft
Est. Value
About This Home
This home is located at 408 W Audubon Dr, Fresno, CA 93711 and is currently estimated at $762,983, approximately $254 per square foot. 408 W Audubon Dr is a home located in Fresno County with nearby schools including Pinedale Elementary School, Kastner Intermediate School, and Clovis West High School.
Ownership History
Date
Name
Owned For
Owner Type
Purchase Details
Closed on
Jul 23, 2021
Sold by
Johnson Arthelma L
Bought by
Johnson Arthelma L and Arthelma L Johnson Living Trus
Current Estimated Value
Home Financials for this Owner
Home Financials are based on the most recent Mortgage that was taken out on this home.
Original Mortgage
$181,836
Outstanding Balance
$164,988
Interest Rate
2.9%
Mortgage Type
New Conventional
Estimated Equity
$597,995
Purchase Details
Closed on
Sep 30, 2013
Sold by
Johnson Arthelma L
Bought by
Johnson Arthelma L
Purchase Details
Closed on
Dec 23, 1993
Sold by
Johnson Odell and Johnson Virginia E
Bought by
Johnson Reynold L and Johnson Arthelma L
Home Financials for this Owner
Home Financials are based on the most recent Mortgage that was taken out on this home.
Original Mortgage
$52,800
Interest Rate
6.98%
Create a Home Valuation Report for This Property
The Home Valuation Report is an in-depth analysis detailing your home's value as well as a comparison with similar homes in the area
Home Values in the Area
Average Home Value in this Area
Purchase History
| Date | Buyer | Sale Price | Title Company |
|---|---|---|---|
| Johnson Arthelma L | -- | Amrock Llc | |
| Johnson Arthelma L | -- | Amrock Llc | |
| Johnson Arthelma L | -- | None Available | |
| Johnson Reynold L | $79,000 | First American Title Ins Co |
Source: Public Records
Mortgage History
| Date | Status | Borrower | Loan Amount |
|---|---|---|---|
| Open | Johnson Arthelma L | $181,836 | |
| Previous Owner | Johnson Reynold L | $52,800 | |
| Closed | Johnson Reynold L | $6,600 |
Source: Public Records
Tax History Compared to Growth
Tax History
| Year | Tax Paid | Tax Assessment Tax Assessment Total Assessment is a certain percentage of the fair market value that is determined by local assessors to be the total taxable value of land and additions on the property. | Land | Improvement |
|---|---|---|---|---|
| 2025 | $5,560 | $473,887 | $152,060 | $321,827 |
| 2023 | $5,452 | $455,487 | $146,156 | $309,331 |
| 2022 | $5,377 | $446,557 | $143,291 | $303,266 |
| 2021 | $5,226 | $437,802 | $140,482 | $297,320 |
| 2020 | $5,204 | $433,314 | $139,042 | $294,272 |
| 2019 | $5,102 | $424,818 | $136,316 | $288,502 |
| 2018 | $4,989 | $416,490 | $133,644 | $282,846 |
| 2017 | $4,902 | $408,324 | $131,024 | $277,300 |
| 2016 | $4,736 | $400,318 | $128,455 | $271,863 |
| 2015 | $4,663 | $394,306 | $126,526 | $267,780 |
| 2014 | $4,575 | $386,583 | $124,048 | $262,535 |
Source: Public Records
Map
Nearby Homes
- 8282 N College Ave
- 8237 N Del Mar Ave
- 8418 N Del Mar Ave
- 8298 N Calaveras St
- 218 W Hubert Ct
- 242 W Hubert Ct
- 317 W Alluvial Ave
- 321 W Minarets Ave
- 0 0 Unit 633401
- 0 0 Unit 631266
- 1110 W Bedford Ave
- 204 W Bluff Ave
- 349 W Birch Ave
- 142 W Birch Ave
- 315 E Nees Ave Unit 155
- 408 W Spruce Ave
- 8052 N Mariposa St
- 7676 N Fresno St Unit 20
- 381 E Nees Ave Unit 133
- 1 River Estate Dr
- 400 W Audubon Dr
- 416 W Audubon Dr
- 8302 N Victor Ave
- 8305 N Victor Ave
- 425 W Audubon Dr
- 8308 N Victor Ave
- 390 W Audubon Dr
- 428 W Audubon Dr
- 417 W Audubon Dr
- 8337 N Churchill Ave
- 431 W Audubon Dr
- 458 W Lexington Ave
- 8351 N Churchill Ave
- 439 W Audubon Dr
- 455 W Bluff Ave
- 426 W Teague Ave
- 441 W Bluff Ave
- 414 W Teague Ave
- 395 W Audubon Dr