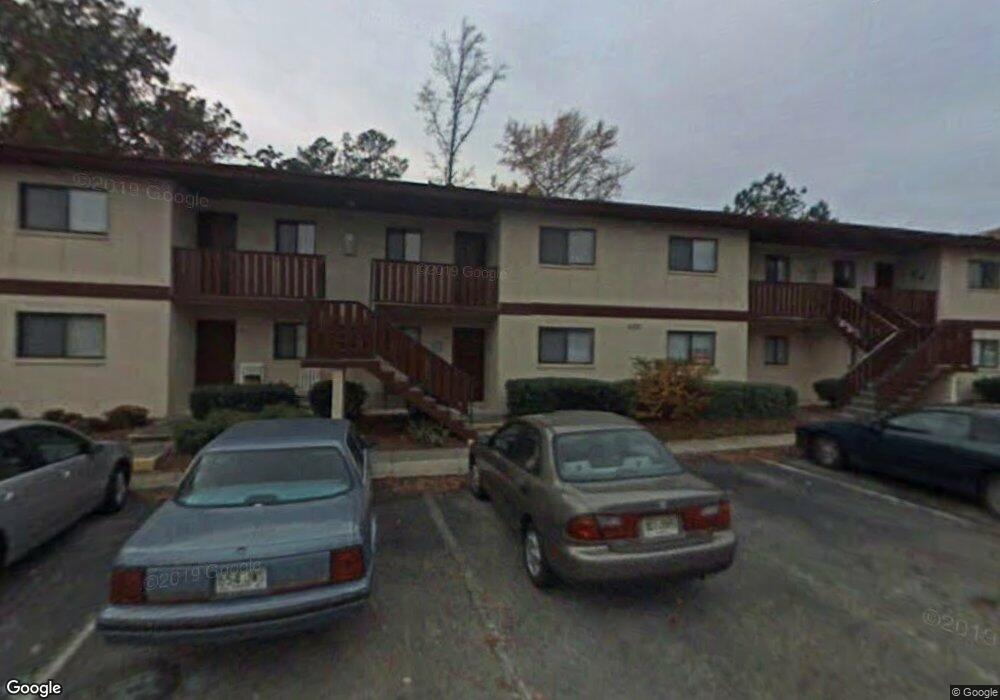
408 Windsong Cir Augusta, GA 30907
Westside NeighborhoodEstimated Value: $84,938 - $99,000
2
Beds
2
Baths
876
Sq Ft
$108/Sq Ft
Est. Value
About This Home
This home is located at 408 Windsong Cir, Augusta, GA 30907 and is currently estimated at $94,485, approximately $107 per square foot. 408 Windsong Cir is a home located in Richmond County with nearby schools including First Coast Technical Institute, R.B. Hunt Elementary School, and Warren Road Elementary School.
Ownership History
Date
Name
Owned For
Owner Type
Purchase Details
Closed on
Feb 20, 2004
Sold by
Bentley Deanna A
Bought by
Wise Janet Susan
Current Estimated Value
Home Financials for this Owner
Home Financials are based on the most recent Mortgage that was taken out on this home.
Original Mortgage
$53,900
Outstanding Balance
$25,154
Interest Rate
5.87%
Estimated Equity
$69,331
Purchase Details
Closed on
Sep 22, 2003
Sold by
Barnes Andrew W
Bought by
Bentley Deanna A
Home Financials for this Owner
Home Financials are based on the most recent Mortgage that was taken out on this home.
Original Mortgage
$26,136
Interest Rate
6.24%
Mortgage Type
Stand Alone First
Purchase Details
Closed on
Apr 14, 1997
Sold by
Bella Thomas Anthon
Bought by
Barnes Andrew W
Create a Home Valuation Report for This Property
The Home Valuation Report is an in-depth analysis detailing your home's value as well as a comparison with similar homes in the area
Home Values in the Area
Average Home Value in this Area
Purchase History
| Date | Buyer | Sale Price | Title Company |
|---|---|---|---|
| Wise Janet Susan | $53,900 | -- | |
| Bentley Deanna A | $35,200 | -- | |
| Barnes Andrew W | $40,300 | -- |
Source: Public Records
Mortgage History
| Date | Status | Borrower | Loan Amount |
|---|---|---|---|
| Open | Wise Janet Susan | $53,900 | |
| Previous Owner | Bentley Deanna A | $26,136 |
Source: Public Records
Tax History Compared to Growth
Tax History
| Year | Tax Paid | Tax Assessment Tax Assessment Total Assessment is a certain percentage of the fair market value that is determined by local assessors to be the total taxable value of land and additions on the property. | Land | Improvement |
|---|---|---|---|---|
| 2025 | $978 | $34,728 | $4,400 | $30,328 |
| 2024 | $978 | $37,356 | $4,400 | $32,956 |
| 2023 | $998 | $30,756 | $4,400 | $26,356 |
| 2022 | $400 | $14,267 | $4,400 | $9,867 |
| 2021 | $414 | $13,458 | $4,400 | $9,058 |
| 2020 | $616 | $20,426 | $4,400 | $16,026 |
| 2019 | $487 | $20,049 | $4,400 | $15,649 |
| 2018 | $491 | $20,049 | $4,400 | $15,649 |
| 2017 | $488 | $20,049 | $4,400 | $15,649 |
| 2016 | $489 | $20,049 | $4,400 | $15,649 |
| 2015 | $493 | $20,049 | $4,400 | $15,649 |
| 2014 | $810 | $20,215 | $4,400 | $15,815 |
Source: Public Records
Map
Nearby Homes
- 1001 Windsong Cir
- 2108 Turtle Ct
- 2111 Turtle Ct
- 1017 Stevens Creek Rd Unit G182
- 1017 Stevens Creek Rd
- 1405 Colony Place Dr
- 3038 Sterling Rd
- 3107 Parrish Rd
- 2020 Autumn Chase
- 826 Mitchell St
- 2044 Bridgewater Dr
- 820 Mitchell St
- 828 Mayo Ln
- 3130 Village West Dr
- 816 Brookfield Pkwy
- 2171 River Park Ct
- 863 Brookfield Pkwy
- 46 Charlestowne Dr
- 2032 Pheasant Creek Dr
- 1094 Hampstead Place
- 407 Windsong Cir
- 406 Windsong Cir
- 405 Windsong Cir
- 404 Windsong Cir
- 403 Windsong Cir
- 401 Windsong Cir Unit 401
- 700 Windsong Cir Unit 700
- 708 Windsong Cir
- 705 Windsong Cir
- 703 Windsong Cir Unit 703
- 706 Windsong Cir
- 707 Windsong Cir
- 702 Windsong Cir
- 701 Windsong Cir
- 605 Windsong Cir
- 604 Windsong Cir
- 608 Windsong Cir Unit 608
- 607 Windsong Cir
- 606 Windsong Cir
- 603 Windsong Cir