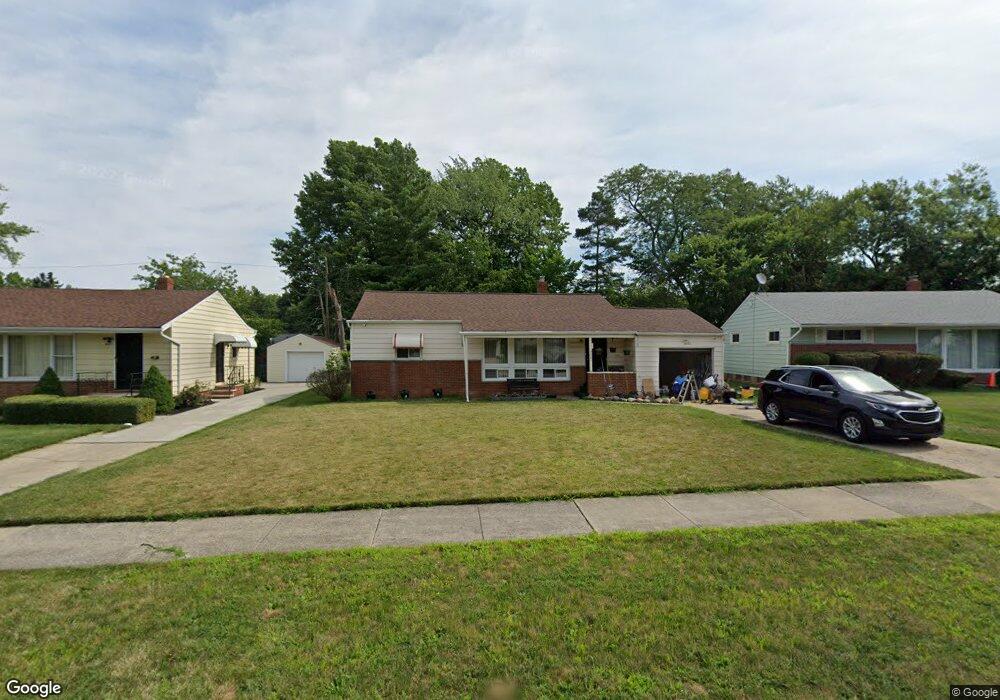
4081 Suffolk Rd Cleveland, OH 44121
Estimated Value: $139,000 - $212,000
3
Beds
2
Baths
1,014
Sq Ft
$162/Sq Ft
Est. Value
About This Home
This home is located at 4081 Suffolk Rd, Cleveland, OH 44121 and is currently estimated at $164,773, approximately $162 per square foot. 4081 Suffolk Rd is a home located in Cuyahoga County with nearby schools including Adrian Elementary School, Greenview Upper Elementary School, and Memorial Junior High School.
Ownership History
Date
Name
Owned For
Owner Type
Purchase Details
Closed on
Feb 14, 2000
Sold by
Hud
Bought by
Jefferson Maria L
Current Estimated Value
Home Financials for this Owner
Home Financials are based on the most recent Mortgage that was taken out on this home.
Original Mortgage
$76,483
Outstanding Balance
$25,486
Interest Rate
8.27%
Mortgage Type
FHA
Estimated Equity
$139,287
Purchase Details
Closed on
Aug 31, 1999
Sold by
Johnson Gina V
Bought by
Hud
Purchase Details
Closed on
Jan 21, 1993
Sold by
Latten Robin R
Bought by
Johnson Gina
Purchase Details
Closed on
May 10, 1987
Sold by
Antonelli Ray M
Bought by
Latten Robin R
Purchase Details
Closed on
Apr 14, 1982
Sold by
Lesniewski Stanley
Bought by
Antonelli Ray M
Purchase Details
Closed on
Jan 1, 1975
Bought by
Lesniewski Stanley
Create a Home Valuation Report for This Property
The Home Valuation Report is an in-depth analysis detailing your home's value as well as a comparison with similar homes in the area
Home Values in the Area
Average Home Value in this Area
Purchase History
| Date | Buyer | Sale Price | Title Company |
|---|---|---|---|
| Jefferson Maria L | $73,000 | Gateway Title Agency Inc | |
| Hud | $55,000 | -- | |
| Johnson Gina | $62,000 | -- | |
| Latten Robin R | $57,500 | -- | |
| Antonelli Ray M | $50,000 | -- | |
| Lesniewski Stanley | -- | -- |
Source: Public Records
Mortgage History
| Date | Status | Borrower | Loan Amount |
|---|---|---|---|
| Open | Jefferson Maria L | $76,483 |
Source: Public Records
Tax History Compared to Growth
Tax History
| Year | Tax Paid | Tax Assessment Tax Assessment Total Assessment is a certain percentage of the fair market value that is determined by local assessors to be the total taxable value of land and additions on the property. | Land | Improvement |
|---|---|---|---|---|
| 2024 | $3,387 | $42,175 | $9,205 | $32,970 |
| 2023 | $3,081 | $30,980 | $7,180 | $23,800 |
| 2022 | $3,065 | $30,975 | $7,175 | $23,800 |
| 2021 | $3,044 | $30,980 | $7,180 | $23,800 |
| 2020 | $2,853 | $25,200 | $5,850 | $19,360 |
| 2019 | $2,617 | $72,000 | $16,700 | $55,300 |
| 2018 | $2,620 | $25,200 | $5,850 | $19,360 |
| 2017 | $2,713 | $24,190 | $5,460 | $18,730 |
| 2016 | $2,696 | $24,190 | $5,460 | $18,730 |
| 2015 | $2,741 | $24,190 | $5,460 | $18,730 |
| 2014 | $2,741 | $25,450 | $5,740 | $19,710 |
Source: Public Records
Map
Nearby Homes
- 4094 Lowden Rd
- 4031 Suffolk Rd
- 3927 Princeton Blvd
- 4090 Princeton Blvd
- 2545 Greenvale Rd
- 2536 Greenvale Rd
- 857 Quarry Dr
- 854 Keystone Dr
- 3882 Wallingford Rd
- 3852 Princeton Blvd
- 3867 Covington Rd
- 925 Keystone Dr
- 855 Roanoke Rd
- 2110 Miami Rd
- 693 Quilliams Rd
- 858 Roanoke Rd
- 4258 Bluestone Rd
- 3762 Covington Rd
- 955 Montford Rd
- 772 Quilliams Rd
- 4077 Suffolk Rd
- 4087 Suffolk Rd
- 4071 Suffolk Rd
- 254 S Green Rd
- 262 S Green Rd
- 4091 Suffolk Rd
- 246 S Green Rd
- 270 S Green Rd
- 238 S Green Rd
- 4065 Suffolk Rd
- 278 S Green Rd
- 4082 Suffolk Rd
- 4088 Suffolk Rd
- 230 S Green Rd
- 4078 Suffolk Rd
- 4097 Dartford Rd
- 286 S Green Rd
- 4061 Suffolk Rd
- 4103 Dartford Rd
- 4096 Suffolk Rd