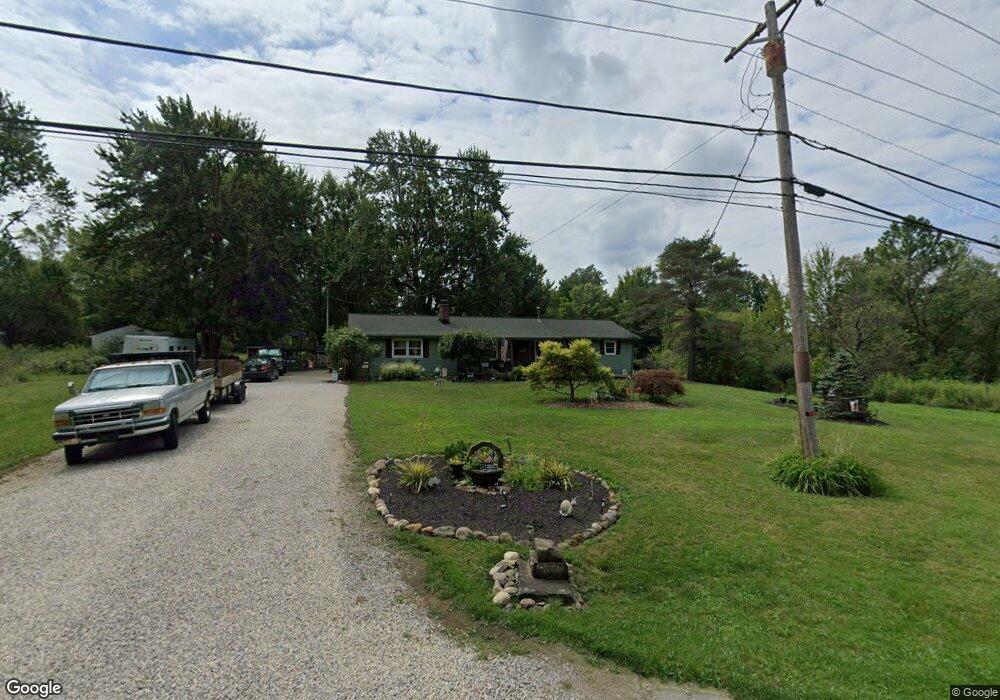
40829 Parsons Rd Lagrange, OH 44050
Estimated Value: $242,521 - $348,000
4
Beds
3
Baths
1,288
Sq Ft
$233/Sq Ft
Est. Value
About This Home
This home is located at 40829 Parsons Rd, Lagrange, OH 44050 and is currently estimated at $300,130, approximately $233 per square foot. 40829 Parsons Rd is a home located in Lorain County with nearby schools including Keystone Elementary School, Keystone Middle School, and Keystone High School.
Ownership History
Date
Name
Owned For
Owner Type
Purchase Details
Closed on
Jun 4, 2003
Sold by
Reloaction
Bought by
Ray Timothy C and Ray Sally J
Current Estimated Value
Home Financials for this Owner
Home Financials are based on the most recent Mortgage that was taken out on this home.
Original Mortgage
$134,662
Outstanding Balance
$57,831
Interest Rate
5.51%
Mortgage Type
VA
Estimated Equity
$242,299
Purchase Details
Closed on
May 29, 2003
Sold by
Haynes Coy A and Haynes Denise M
Bought by
Reloaction
Home Financials for this Owner
Home Financials are based on the most recent Mortgage that was taken out on this home.
Original Mortgage
$134,662
Outstanding Balance
$57,831
Interest Rate
5.51%
Mortgage Type
VA
Estimated Equity
$242,299
Purchase Details
Closed on
May 28, 1996
Sold by
Huber Lawrence R
Bought by
Haynes Coy A and Haynes Denise M
Home Financials for this Owner
Home Financials are based on the most recent Mortgage that was taken out on this home.
Original Mortgage
$92,650
Interest Rate
8.1%
Mortgage Type
Balloon
Create a Home Valuation Report for This Property
The Home Valuation Report is an in-depth analysis detailing your home's value as well as a comparison with similar homes in the area
Home Values in the Area
Average Home Value in this Area
Purchase History
| Date | Buyer | Sale Price | Title Company |
|---|---|---|---|
| Ray Timothy C | $148,000 | Midland | |
| Reloaction | $148,000 | Midland | |
| Haynes Coy A | $109,000 | -- |
Source: Public Records
Mortgage History
| Date | Status | Borrower | Loan Amount |
|---|---|---|---|
| Open | Ray Timothy C | $134,662 | |
| Previous Owner | Haynes Coy A | $92,650 |
Source: Public Records
Tax History
| Year | Tax Paid | Tax Assessment Tax Assessment Total Assessment is a certain percentage of the fair market value that is determined by local assessors to be the total taxable value of land and additions on the property. | Land | Improvement |
|---|---|---|---|---|
| 2024 | $3,057 | $74,340 | $19,996 | $54,345 |
| 2023 | $2,931 | $59,651 | $19,401 | $40,250 |
| 2022 | $2,909 | $59,651 | $19,401 | $40,250 |
| 2021 | $2,909 | $59,651 | $19,401 | $40,250 |
| 2020 | $2,574 | $47,010 | $15,290 | $31,720 |
| 2019 | $2,558 | $47,010 | $15,290 | $31,720 |
| 2018 | $2,523 | $47,010 | $15,290 | $31,720 |
| 2017 | $2,551 | $45,070 | $16,180 | $28,890 |
| 2016 | $2,533 | $45,070 | $16,180 | $28,890 |
| 2015 | $2,528 | $45,070 | $16,180 | $28,890 |
| 2014 | $2,078 | $42,520 | $15,260 | $27,260 |
| 2013 | $2,013 | $42,520 | $15,260 | $27,260 |
Source: Public Records
Map
Nearby Homes
- 40175 Banks Rd
- 40163 Banks Rd
- 340 Granger Dr
- 808 Buckingham Dr
- 800 Buckingham Dr
- 801 Willich Ct
- 41341 Ravines Edge Way
- 548 William St
- 516 Appomattox Ct
- 13301 Indian Hollow Rd
- 317 Church St
- 1033 Parsons Rd Unit 11
- 1207 Fox Run
- 1167 Fox Run
- 0 Dill Ct Unit 5072837
- 305 W Main St
- 551 N Main St
- 110 Railroad St
- 697 Main St
- 1017 Glendalough Ave
- 328 Church St
- 40801 Parsons Rd
- 40767 Parsons Rd
- 40741 Parsons Rd
- 40921 Parsons Rd
- 41012 Parsons Rd
- 40699 Parsons Rd
- 40699 Parsons Rd
- 40700 Parsons Rd
- 14539 State Route 301
- 14623 State Route 301
- 40671 Parsons Rd
- 14211 State Route 301
- 14673 State Route 301
- 40637 Parsons Rd
- 14169 State Route 301
- 14394 Lagrange Rd
- VL E Lagrange Rd
- 40619 Parsons Rd
- 14394 State Route 301
Your Personal Tour Guide
Ask me questions while you tour the home.