
Seller's Agent in 2026
Chad Madlom Team
Madlom Real Estate
1 in this area
21 Total Sales


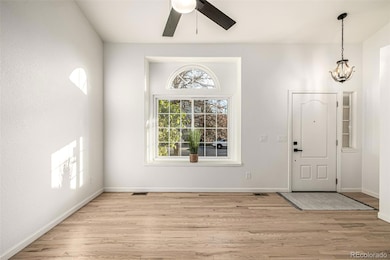

Fantastic 3 bed, 4 bath residence in Spring Creek Meadows. Featuring a charming front yard, 3 car garage, and a welcoming front porch! Inside you will find a wonderful living room w/vaulted ceilings, new LVP flooring, and neutral palette throughout. Laundry is conveniently located upstairs with the bedrooms. Continue into the large family room, boasting a fireplace to keep you warm & cozy during the coming winter months. The eat-in kitchen is equipped w/shaker cabinetry, granite counters, dove-tailed soft close cabinets, tile backsplash, SS appliances, and a peninsula w/a breakfast bar. LED lighting has been added throughout. The primary suite showcases plush carpet, a walk-in closet, and a full 5 piece bathroom for added comfort. Home has Air conditioning. Don't forget about the huge basement bonus room and updated bathroom, ideal for an entertainment center or a 4th bedroom! Also including a lovely backyard and patio area where you can spend quality time w/friends & loved ones, this home has it all! Don't miss out! House is agent owned.
Last Agent to Sell the Property
Madlom Real Estate Brokerage Email: Chad@ChadMadlom.com,303-596-3957 License #40034414 Listed on: 11/07/2025
| Date | Type | Sale Price | Title Company |
|---|---|---|---|
| Warranty Deed | $575,000 | Fitco (First Integrity Title C | |
| Special Warranty Deed | $400,000 | Fitco (First Integrity Title C | |
| Special Warranty Deed | $410,000 | Fitco (First Integrity Title C | |
| Interfamily Deed Transfer | -- | None Available | |
| Deed | -- | -- | |
| Deed | -- | -- | |
| Deed | -- | -- | |
| Deed | -- | -- | |
| Deed | -- | -- | |
| Deed | -- | -- |
| Date | Status | Loan Amount | Loan Type |
|---|---|---|---|
| Open | $22,466 | New Conventional | |
| Open | $561,660 | FHA | |
| Previous Owner | $432,000 | Construction |
| Date | Event | Price | List to Sale | Price per Sq Ft | Prior Sale |
|---|---|---|---|---|---|
| 02/26/2026 02/26/26 | Sold | $575,000 | 0.0% | $266 / Sq Ft | |
| 01/04/2026 01/04/26 | Price Changed | $575,000 | -1.7% | $266 / Sq Ft | |
| 12/10/2025 12/10/25 | Price Changed | $585,000 | -2.5% | $270 / Sq Ft | |
| 11/19/2025 11/19/25 | Price Changed | $599,850 | 0.0% | $277 / Sq Ft | |
| 11/10/2025 11/10/25 | Price Changed | $599,900 | -4.0% | $277 / Sq Ft | |
| 11/07/2025 11/07/25 | For Sale | $625,000 | +56.3% | $289 / Sq Ft | |
| 10/03/2025 10/03/25 | Sold | $400,000 | -18.4% | $180 / Sq Ft | View Prior Sale |
| 09/21/2025 09/21/25 | For Sale | $490,000 | -- | $220 / Sq Ft |
| Year | Tax Paid | Tax Assessment Tax Assessment Total Assessment is a certain percentage of the fair market value that is determined by local assessors to be the total taxable value of land and additions on the property. | Land | Improvement |
|---|---|---|---|---|
| 2025 | $3,135 | $33,363 | -- | -- |
| 2024 | $2,788 | $36,415 | -- | -- |
| 2023 | $2,788 | $36,415 | $0 | $0 |
| 2022 | $2,218 | $29,204 | $0 | $0 |
| 2021 | $2,226 | $29,204 | $0 | $0 |
| 2020 | $2,737 | $28,150 | $0 | $0 |
| 2019 | $2,642 | $28,150 | $0 | $0 |
| 2018 | $2,485 | $23,645 | $0 | $0 |
| 2017 | $2,443 | $23,645 | $0 | $0 |
| 2016 | $2,359 | $21,651 | $0 | $0 |
| 2015 | $2,277 | $21,651 | $0 | $0 |
| 2014 | $1,918 | $16,541 | $0 | $0 |
| 2013 | -- | $16,700 | $0 | $0 |
Seller's Agent in 2026
Chad Madlom Team
Madlom Real Estate
1 in this area
21 Total Sales
Buyer's Agent in 2026
Angela Hutton-Hall
City Park Realty LLC
(303) 332-2011
1 in this area
64 Total Sales
Seller's Agent in 2025
Jerry Glass
Realty One Group Elevations, LLC
(720) 490-5909
1 in this area
17 Total Sales
T
Buyer's Agent in 2025
Turin Alexander
Brokers Guild Homes
(803) 487-3972
1 in this area
3 Total Sales
Source: REcolorado®
MLS Number: 7639365
APN: 2073-02-3-15-003
Disclaimer: Certain information contained herein is derived from information provided by parties other than Homes.com. All information provided is deemed reliable, but is not guaranteed to be accurate and should be independently verified.
![]() Based on information submitted to the MLS GRID. All data is obtained from various sources and may not have been verified by broker or MLS GRID. Supplied Open House Information is subject to change without notice. All information should be independently reviewed and verified for accuracy. Properties may or may not be listed by the office/agent presenting the information. Some IDX listings have been excluded from this website. The content relating to real estate for sale in this Web site comes in part from the Internet Data eXchange (“IDX”) program of METROLIST, INC., DBA RECOLORADO®. Real estate listings held by brokers other than Ten-X are marked with the IDX Logo. This information is being provided for the consumers’ personal, non-commercial use and may not be used for any other purpose. All information is subject to change and should be independently verified.
Based on information submitted to the MLS GRID. All data is obtained from various sources and may not have been verified by broker or MLS GRID. Supplied Open House Information is subject to change without notice. All information should be independently reviewed and verified for accuracy. Properties may or may not be listed by the office/agent presenting the information. Some IDX listings have been excluded from this website. The content relating to real estate for sale in this Web site comes in part from the Internet Data eXchange (“IDX”) program of METROLIST, INC., DBA RECOLORADO®. Real estate listings held by brokers other than Ten-X are marked with the IDX Logo. This information is being provided for the consumers’ personal, non-commercial use and may not be used for any other purpose. All information is subject to change and should be independently verified.
This publication is designed to provide information with regard to the subject matter covered. It is displayed with the understanding that the publisher and authors are not engaged in rendering real estate, legal, accounting, tax, or other professional services and that the publisher and authors are not offering such advice in this publication. If real estate, legal, or other expert assistance is required, the services of a competent, professional person should be sought.
The information contained in this publication is subject to change without notice. METROLIST, INC., DBA RECOLORADO MAKES NO WARRANTY OF ANY KIND WITH REGARD TO THIS MATERIAL, INCLUDING, BUT NOT LIMITED TO, THE IMPLIED WARRANTIES OF MERCHANTABILITY AND FITNESS FOR A PARTICULAR PURPOSE. METROLIST, INC., DBA RECOLORADO SHALL NOT BE LIABLE FOR ERRORS CONTAINED HEREIN OR FOR ANY DAMAGES IN CONNECTION WITH THE FURNISHING, PERFORMANCE, OR USE OF THIS MATERIAL.
PUBLISHER’S NOTICE: All real estate advertised herein is subject to the Federal Fair Housing Act and the Colorado Fair Housing Act, which Acts make it illegal to make or publish any advertisement that indicates any preference, limitation, or discrimination based on race, color, religion, sex, handicap, familial status, or national origin.
METROLIST, INC., DBA RECOLORADO will not knowingly accept any advertising for real estate that is in violation of the law. All persons are hereby informed that all dwellings advertised are available on an equal opportunity basis.
© 2026 METROLIST, INC., DBA RECOLORADO® – All Rights Reserved. 6455 S. Yosemite St., Suite 500 Greenwood Village, CO 80111 USA
ALL RIGHTS RESERVED WORLDWIDE. No part of this publication may be reproduced, adapted, translated, stored in a retrieval system or transmitted in any form or by any means, electronic, mechanical, photocopying, recording, or otherwise, without the prior written permission of the publisher. The information contained herein including but not limited to all text, photographs, digital images, virtual tours, may be seeded and monitored for protection and tracking.
Based on information submitted to the MLS GRID
Ask me questions while you tour the home.