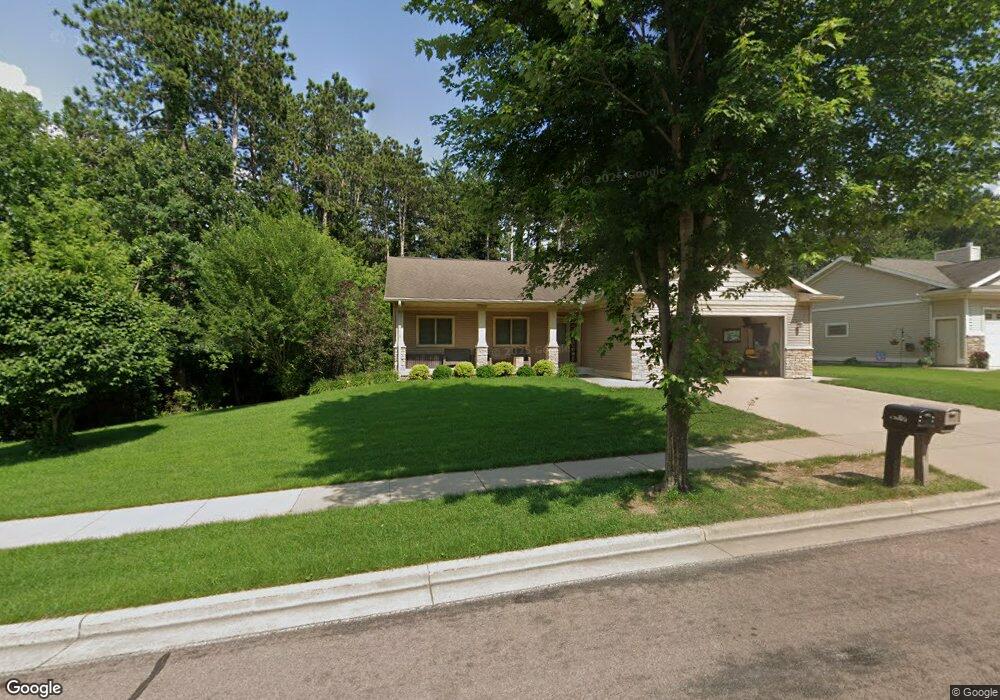
4086 Pineview St Onalaska, WI 54650
Estimated Value: $445,000 - $492,000
4
Beds
3
Baths
2,964
Sq Ft
$158/Sq Ft
Est. Value
About This Home
This home is located at 4086 Pineview St, Onalaska, WI 54650 and is currently estimated at $468,417, approximately $158 per square foot. 4086 Pineview St is a home located in La Crosse County with nearby schools including Eagle Bluff Elementary School, Onalaska High School, and St. Paul's Lutheran School.
Ownership History
Date
Name
Owned For
Owner Type
Purchase Details
Closed on
Apr 10, 2020
Sold by
Walz Bradley J and Walz Britni
Bought by
Benson Tony M and Benson Jesse D
Current Estimated Value
Home Financials for this Owner
Home Financials are based on the most recent Mortgage that was taken out on this home.
Original Mortgage
$321,100
Interest Rate
3.3%
Mortgage Type
New Conventional
Purchase Details
Closed on
Jan 25, 2012
Sold by
Valley View Business Park Llp
Bought by
Miller Benjamin R and Miller Crystal D
Purchase Details
Closed on
Oct 6, 2010
Sold by
Evenson & Company Inc
Bought by
Walz Bradley J
Home Financials for this Owner
Home Financials are based on the most recent Mortgage that was taken out on this home.
Original Mortgage
$199,920
Interest Rate
4.3%
Mortgage Type
New Conventional
Purchase Details
Closed on
Jun 9, 2010
Sold by
Evenson Kevin D and Evenson Keith M
Bought by
Even Trio Llc
Create a Home Valuation Report for This Property
The Home Valuation Report is an in-depth analysis detailing your home's value as well as a comparison with similar homes in the area
Home Values in the Area
Average Home Value in this Area
Purchase History
| Date | Buyer | Sale Price | Title Company |
|---|---|---|---|
| Benson Tony M | $338,000 | Town & Country Title | |
| Miller Benjamin R | -- | None Available | |
| Walz Bradley J | $249,900 | None Available | |
| Evenson & Company Inc | $59,900 | None Available | |
| Even Trio Llc | -- | None Available | |
| Evenson Kevin D | -- | None Available | |
| Evenson David M | -- | None Available |
Source: Public Records
Mortgage History
| Date | Status | Borrower | Loan Amount |
|---|---|---|---|
| Previous Owner | Benson Tony M | $321,100 | |
| Previous Owner | Evenson & Company Inc | $199,920 |
Source: Public Records
Tax History
| Year | Tax Paid | Tax Assessment Tax Assessment Total Assessment is a certain percentage of the fair market value that is determined by local assessors to be the total taxable value of land and additions on the property. | Land | Improvement |
|---|---|---|---|---|
| 2025 | $5,811 | $439,900 | $76,700 | $363,200 |
| 2024 | $6,029 | $353,200 | $42,600 | $310,600 |
| 2023 | $5,601 | $353,200 | $42,600 | $310,600 |
| 2022 | $5,411 | $353,200 | $42,600 | $310,600 |
| 2021 | $6,012 | $343,200 | $53,700 | $289,500 |
| 2020 | $6,017 | $343,200 | $53,700 | $289,500 |
| 2019 | $6,161 | $343,200 | $53,700 | $289,500 |
| 2018 | $5,538 | $283,000 | $53,700 | $229,300 |
| 2017 | $5,476 | $281,200 | $53,700 | $227,500 |
| 2016 | $5,702 | $281,200 | $53,700 | $227,500 |
| 2015 | $5,468 | $251,200 | $51,500 | $199,700 |
| 2014 | $5,427 | $251,200 | $51,500 | $199,700 |
| 2013 | $5,402 | $251,200 | $51,500 | $199,700 |
Source: Public Records
Map
Nearby Homes
- Lot 22 Gabrielle Way
- Lot 2 Gabrielle Way
- Lot 20 Gabrielle Way
- Lot 21 Gabrielle Way
- Lot 3 Brooke Elizabeth Dr
- Lot 19 Gabrielle Way
- Lot #1 Gabrielle Way
- Lt 2 Gabrielle Way
- 3767 Emerald Dr E
- 475 Coronado Cir
- Lot 5 Brooke Elizabeth Dr
- Lot 4 Brooke Elizabeth Dr
- 4043 Brooke Elizabeth Dr
- Lot 45 Madison Heights Dr
- 4060 Brooke Elizabeth Dr
- 4051 Brooke Elizabeth Dr
- Lot 29 Brooke Elizabeth Dr
- Lot 38 Madison Heights Dr
- Lot 37 Madison Heights Dr
- Lot #28 Brooke Elizabeth Dr
- 4076 Pineview St
- 4087 Pineview St
- 4077 Pineview St
- 4066 Pineview St
- 4067 Pineview St
- 4057 Pineview St
- 4056 Pineview St
- 1023 Valley Vue Dr
- 4046 Pineview St
- 3908 S Kinney Coulee Rd
- 1017 Valley Vue Dr
- 1031 Valley Vue Dr
- 1018 Valley Vue Dr
- 4036 Pineview St
- 1010 Valley Vue Dr
- 1026 Valley Vue Dr
- 1009 Valley Vue Dr
- 4026 Pineview St
- 1041 Valley Vue Dr
- 4016 Pineview St
Your Personal Tour Guide
Ask me questions while you tour the home.