Estimated Value: $599,000 - $767,000
4
Beds
2
Baths
1,487
Sq Ft
$482/Sq Ft
Est. Value
About This Home
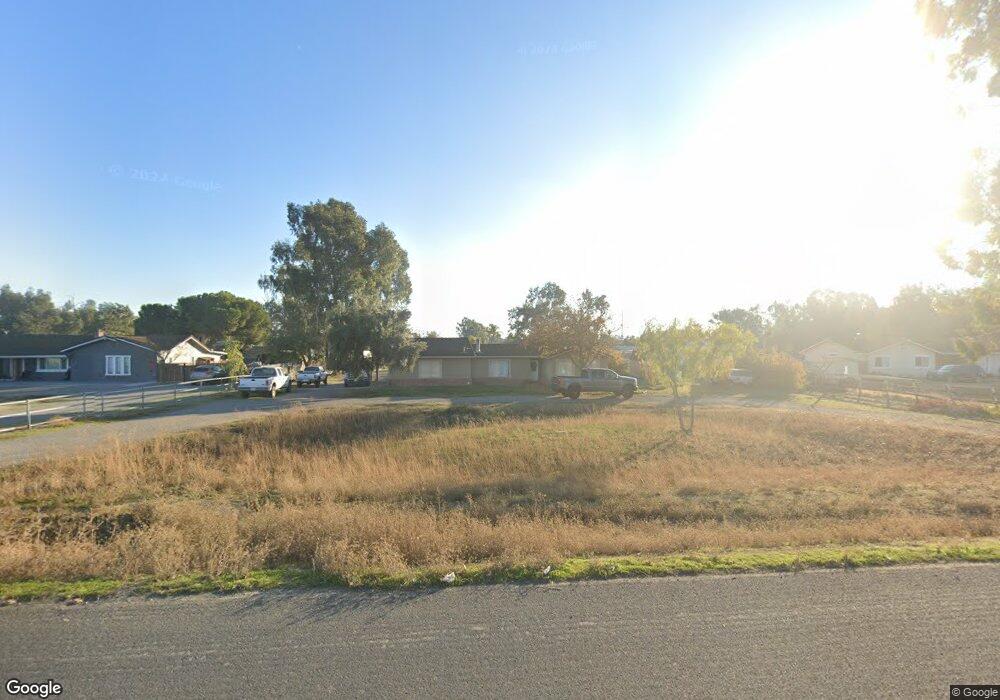
This home is located at 4086 W Grant Line Rd, Tracy, CA 95304 and is currently estimated at $716,487, approximately $481 per square foot. 4086 W Grant Line Rd is a home located in San Joaquin County with nearby schools including Banta Elementary School, Tracy High School, and Banta Charter School.
Ownership History
Date
Name
Owned For
Owner Type
Purchase Details
Closed on
Apr 19, 2004
Sold by
Dutro Daniel
Bought by
Dutro Daniel and Dutro Lisa
Current Estimated Value
Home Financials for this Owner
Home Financials are based on the most recent Mortgage that was taken out on this home.
Original Mortgage
$399,750
Outstanding Balance
$174,384
Interest Rate
4.62%
Mortgage Type
New Conventional
Estimated Equity
$542,103
Purchase Details
Closed on
May 2, 2003
Sold by
Dutro Lisa
Bought by
Dutro Daniel
Home Financials for this Owner
Home Financials are based on the most recent Mortgage that was taken out on this home.
Original Mortgage
$365,750
Interest Rate
5.84%
Mortgage Type
Unknown
Purchase Details
Closed on
Nov 9, 1993
Sold by
Va
Bought by
Mccloud Robert M and Mccloud Katelyn
Home Financials for this Owner
Home Financials are based on the most recent Mortgage that was taken out on this home.
Original Mortgage
$67,000
Interest Rate
6.89%
Create a Home Valuation Report for This Property
The Home Valuation Report is an in-depth analysis detailing your home's value as well as a comparison with similar homes in the area
Purchase History
| Date | Buyer | Sale Price | Title Company |
|---|---|---|---|
| Dutro Daniel | -- | First Amer Title Co | |
| Dutro Daniel | -- | Fidelity Natl Title Ins Co | |
| Dutro Daniel | $385,000 | Fidelity Natl Title Ins Co | |
| Mccloud Robert M | -- | Fidelity National Title Co |
Source: Public Records
Mortgage History
| Date | Status | Borrower | Loan Amount |
|---|---|---|---|
| Open | Dutro Daniel | $399,750 | |
| Closed | Dutro Daniel | $365,750 | |
| Previous Owner | Mccloud Robert M | $67,000 |
Source: Public Records
Tax History
| Year | Tax Paid | Tax Assessment Tax Assessment Total Assessment is a certain percentage of the fair market value that is determined by local assessors to be the total taxable value of land and additions on the property. | Land | Improvement |
|---|---|---|---|---|
| 2025 | $5,883 | $557,570 | $144,820 | $412,750 |
| 2024 | $5,701 | $546,638 | $141,981 | $404,657 |
| 2023 | $5,605 | $535,921 | $139,198 | $396,723 |
| 2022 | $5,506 | $525,414 | $136,469 | $388,945 |
| 2021 | $5,425 | $515,113 | $133,794 | $381,319 |
| 2020 | $5,387 | $509,833 | $132,423 | $377,410 |
| 2019 | $5,301 | $499,837 | $129,827 | $370,010 |
| 2018 | $5,220 | $490,037 | $127,282 | $362,755 |
| 2017 | $5,107 | $480,430 | $124,787 | $355,643 |
| 2016 | $5,022 | $471,013 | $122,341 | $348,672 |
| 2014 | $4,239 | $392,000 | $102,000 | $290,000 |
Source: Public Records
Map
Nearby Homes
- 4151 W Canal Blvd
- 3701 Canal Blvd
- 17906 Glen Arbor Way
- 17894 Glen Arbor Way
- 17786 Brightwood Ave
- 3778 Bradbury Ave
- 17738 Brightwood Ave
- 2929 N Macarthur Dr Unit 173
- 1737 Cranbrook Ct
- 613 Carol Louise Ln
- 17585 Bushwick Ln
- 3140 Green Meadow Ln
- 17618 Brightwood Ave
- 17997 Reunion Ct
- 17549 Bushwick Ln
- 17738 Griswold Ct
- 3176 Bosworth St
- 17726 Griswold Ct
- 3148 Bosworth St
- 3134 Bosworth St
- 4034 W Grant Line Rd
- 4126 W Grant Line Rd
- 4182 W Grant Line Rd
- 3917 W Stoneridge Rd
- 4133 Rocky Point Ct
- 4133 Rocky Point Ct
- 3901 W Stoneridge Rd
- 3901 Stoneridge Dr
- 4220 W Grant Line Rd
- 3941 W Stoneridge Rd
- 3959 W Stoneridge Rd
- 4274 W Grant Line Rd
- 4102 Rocky Point Ct
- 4189 Rocky Point Ct
- 3900 W Stoneridge Rd
- 3900 Stoneridge Dr
- 4003 W Stoneridge Rd
- 4150 Rocky Point Ct
- 4003 Stoneridge Dr
- 4255 Rocky Point Ct
Your Personal Tour Guide
Ask me questions while you tour the home.