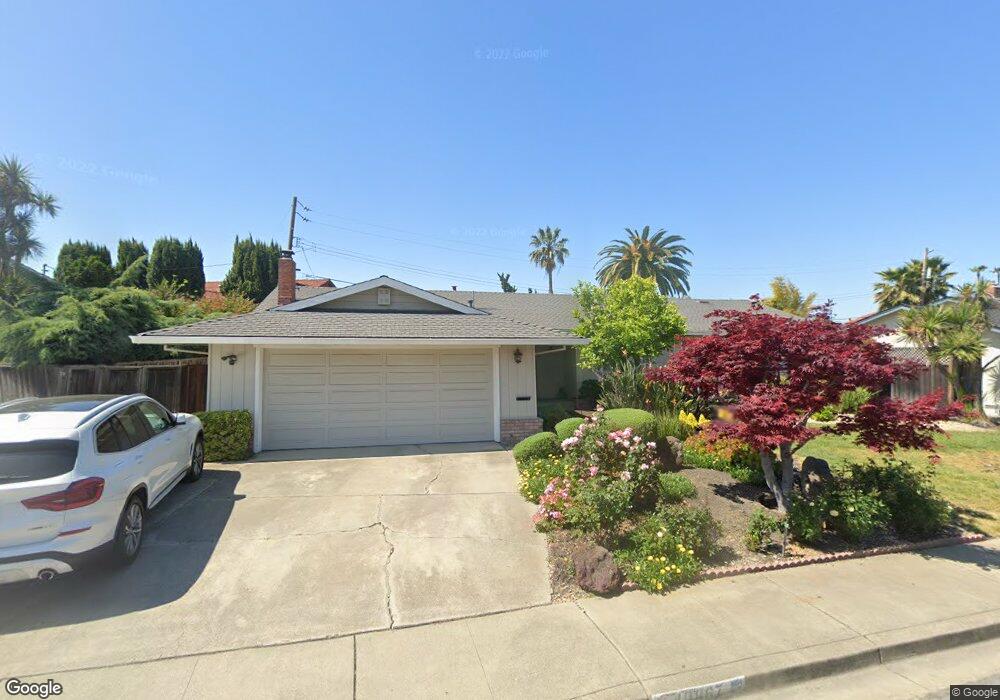
40867 Mino Way Fremont, CA 94539
Kimber-Gomes NeighborhoodEstimated Value: $2,002,000 - $2,517,000
4
Beds
2
Baths
1,720
Sq Ft
$1,322/Sq Ft
Est. Value
About This Home
This home is located at 40867 Mino Way, Fremont, CA 94539 and is currently estimated at $2,273,017, approximately $1,321 per square foot. 40867 Mino Way is a home located in Alameda County with nearby schools including John Gomes Elementary School, William Hopkins Junior High School, and Mission San Jose High School.
Ownership History
Date
Name
Owned For
Owner Type
Purchase Details
Closed on
Oct 14, 2019
Sold by
Cheng Chih Heng
Bought by
Cheng Chih Heng and Henry Chih Heng Cheng Revocabl
Current Estimated Value
Purchase Details
Closed on
Aug 28, 2002
Sold by
Cheng Chih Heng
Bought by
Cheng Chih Heng
Home Financials for this Owner
Home Financials are based on the most recent Mortgage that was taken out on this home.
Original Mortgage
$296,500
Outstanding Balance
$124,310
Interest Rate
6.29%
Estimated Equity
$2,148,707
Purchase Details
Closed on
Apr 19, 2001
Sold by
Hsu Ming Tzu
Bought by
Cheng Chih Heng
Purchase Details
Closed on
Nov 21, 1997
Sold by
Friddle Michael H and Friddle Margaret F
Bought by
Cheng Chih Heng and Hsu Ming Tzu
Home Financials for this Owner
Home Financials are based on the most recent Mortgage that was taken out on this home.
Original Mortgage
$311,200
Interest Rate
7.33%
Create a Home Valuation Report for This Property
The Home Valuation Report is an in-depth analysis detailing your home's value as well as a comparison with similar homes in the area
Home Values in the Area
Average Home Value in this Area
Purchase History
| Date | Buyer | Sale Price | Title Company |
|---|---|---|---|
| Cheng Chih Heng | -- | None Available | |
| Cheng Chih Heng | -- | Fidelity National Title Co | |
| Cheng Chih Heng | -- | -- | |
| Cheng Chih Heng | $415,000 | North American Title Co |
Source: Public Records
Mortgage History
| Date | Status | Borrower | Loan Amount |
|---|---|---|---|
| Open | Cheng Chih Heng | $296,500 | |
| Closed | Cheng Chih Heng | $311,200 |
Source: Public Records
Tax History Compared to Growth
Tax History
| Year | Tax Paid | Tax Assessment Tax Assessment Total Assessment is a certain percentage of the fair market value that is determined by local assessors to be the total taxable value of land and additions on the property. | Land | Improvement |
|---|---|---|---|---|
| 2025 | $8,106 | $655,617 | $198,785 | $463,832 |
| 2024 | $8,106 | $642,627 | $194,888 | $454,739 |
| 2023 | $7,883 | $636,891 | $191,067 | $445,824 |
| 2022 | $7,774 | $617,404 | $187,321 | $437,083 |
| 2021 | $7,584 | $605,161 | $183,648 | $428,513 |
| 2020 | $7,582 | $605,887 | $181,766 | $424,121 |
| 2019 | $7,496 | $594,010 | $178,203 | $415,807 |
| 2018 | $7,348 | $582,364 | $174,709 | $407,655 |
| 2017 | $7,164 | $570,948 | $171,284 | $399,664 |
| 2016 | $7,038 | $559,755 | $167,926 | $391,829 |
| 2015 | $6,940 | $551,347 | $165,404 | $385,943 |
| 2014 | $6,818 | $540,548 | $162,164 | $378,384 |
Source: Public Records
Map
Nearby Homes
- 1401 Lemos Ln
- 1962 Briscoe Terrace
- 40827 Tomales Terrace
- 41043 Joyce Ave
- 2813 Pinnacles Terrace
- 41411 Apricot Ln
- 1137 Farragut Dr
- 2851 Finca Terrace
- 1123 Farragut Dr
- 41519 Apricot Ln
- 40425 Chapel Way Unit 214
- 40425 Chapel Way Unit 309
- 41392 Beatrice St
- 3331 Union St
- 41620 Beatrice St
- 40469 Shaw Ct
- 260 Jacaranda Dr
- 40613 Encanto Way
- 41538 Casabella Common
- 3207 Washington Blvd