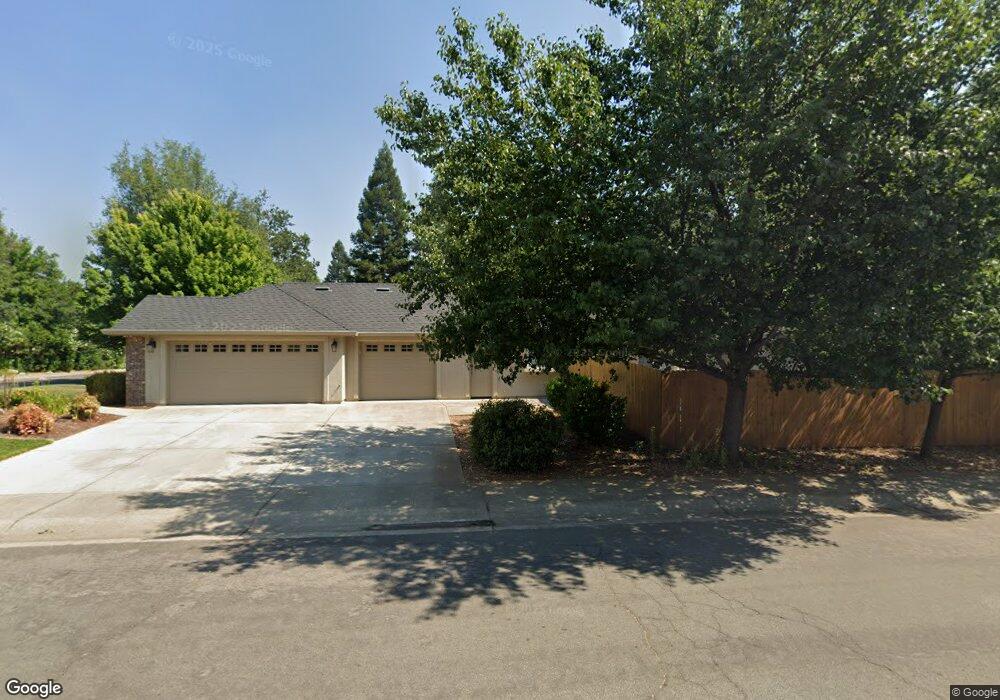
4087 Cloverway Dr Redding, CA 96002
Goodwater NeighborhoodEstimated Value: $608,048 - $681,000
4
Beds
2
Baths
2,538
Sq Ft
$255/Sq Ft
Est. Value
About This Home
This home is located at 4087 Cloverway Dr, Redding, CA 96002 and is currently estimated at $646,262, approximately $254 per square foot. 4087 Cloverway Dr is a home located in Shasta County with nearby schools including Prairie Elementary School, Pacheco Elementary School, and California Heritage Youth Build Academy.
Ownership History
Date
Name
Owned For
Owner Type
Purchase Details
Closed on
Feb 4, 2019
Sold by
Dent Michael E
Bought by
Dent Michael E and Michael E Dent 2019 Family Tru
Current Estimated Value
Purchase Details
Closed on
Jan 26, 2010
Sold by
Dent Leslie D
Bought by
Dent Michael E
Purchase Details
Closed on
Nov 6, 2000
Sold by
Schweitzer John W
Bought by
Schweitzer John and Schweitzer Kathleen Marie
Purchase Details
Closed on
Jun 5, 1998
Sold by
Schweitzer Terry L
Bought by
Schweitzer John W
Purchase Details
Closed on
Apr 1, 1997
Sold by
Carriage Glen Ltd
Bought by
Schweitzer John W and Schweitzer Terry L
Home Financials for this Owner
Home Financials are based on the most recent Mortgage that was taken out on this home.
Original Mortgage
$184,000
Interest Rate
7.66%
Create a Home Valuation Report for This Property
The Home Valuation Report is an in-depth analysis detailing your home's value as well as a comparison with similar homes in the area
Home Values in the Area
Average Home Value in this Area
Purchase History
| Date | Buyer | Sale Price | Title Company |
|---|---|---|---|
| Dent Michael E | -- | None Available | |
| Dent Michael E | -- | Fidelity Natl Title Co Of Ca | |
| Dent Michael E | $351,000 | Fidelity Natl Title Co Of Ca | |
| Schweitzer John | -- | -- | |
| Schweitzer John W | -- | First American Title Co | |
| Schweitzer John W | $230,000 | Redding Title Company |
Source: Public Records
Mortgage History
| Date | Status | Borrower | Loan Amount |
|---|---|---|---|
| Previous Owner | Schweitzer John W | $184,000 |
Source: Public Records
Tax History
| Year | Tax Paid | Tax Assessment Tax Assessment Total Assessment is a certain percentage of the fair market value that is determined by local assessors to be the total taxable value of land and additions on the property. | Land | Improvement |
|---|---|---|---|---|
| 2025 | $4,742 | $453,063 | $96,803 | $356,260 |
| 2024 | $4,648 | $444,180 | $94,905 | $349,275 |
| 2023 | $4,648 | $435,472 | $93,045 | $342,427 |
| 2022 | $4,532 | $426,934 | $91,221 | $335,713 |
| 2021 | $4,461 | $418,564 | $89,433 | $329,131 |
| 2020 | $4,407 | $414,273 | $88,516 | $325,757 |
| 2019 | $4,351 | $406,151 | $86,781 | $319,370 |
| 2018 | $4,180 | $398,188 | $85,080 | $313,108 |
| 2017 | $4,238 | $390,381 | $83,412 | $306,969 |
| 2016 | $4,009 | $382,727 | $81,777 | $300,950 |
| 2015 | $4,004 | $376,979 | $80,549 | $296,430 |
| 2014 | $3,957 | $369,596 | $78,972 | $290,624 |
Source: Public Records
Map
Nearby Homes
- 2875 Eastbrook Dr
- 2704 Western Oak Dr
- 2427 Castlewood Dr
- 3030 Clear Water Ct
- 3733 Capricorn Way
- 3792 Thomason Trail
- 3688 Polaris Way
- 2366 Templeton Dr
- 3512 Capricorn Way
- 2332 Venus Way
- 3685 Wimbledon Dr
- 3183 Agassi Ln
- 2498 Saturn Skyway
- 3086 Henrys Fork Dr
- 3874 Palm Springs Dr
- 2364 La Madre Ct
- 2995 Henrys Fork Dr
- 4655 Goodwater Ave
- 4813 St Charles Dr
- 4646 Alta Camino Dr
- 4047 Cloverway Dr
- 4090 Aspen Springs Ct
- 4105 Cloverway Dr
- 2598 Eastbrook 4% To So
- 4050 Aspen Springs Ct
- 2598 Eastbrook Dr
- 2675 Castlewood Dr
- 4110 Aspen Springs Ct
- 4007 Cloverway Dr
- 4175 Cloverway Dr
- 2593 Eastbrook Dr
- 2578 Eastbrook Dr Unit 1
- 2578 Eastbrook Dr
- 4030 Aspen Springs Ct
- 0 Aspen Springs Ct
- 4130 Aspen Springs Ct Unit LOT 18
- 4130 Aspen Springs Ct
- 2625 Castlewood Dr
- 2690 Castlewood Dr
- 4205 Cloverway Dr
Your Personal Tour Guide
Ask me questions while you tour the home.