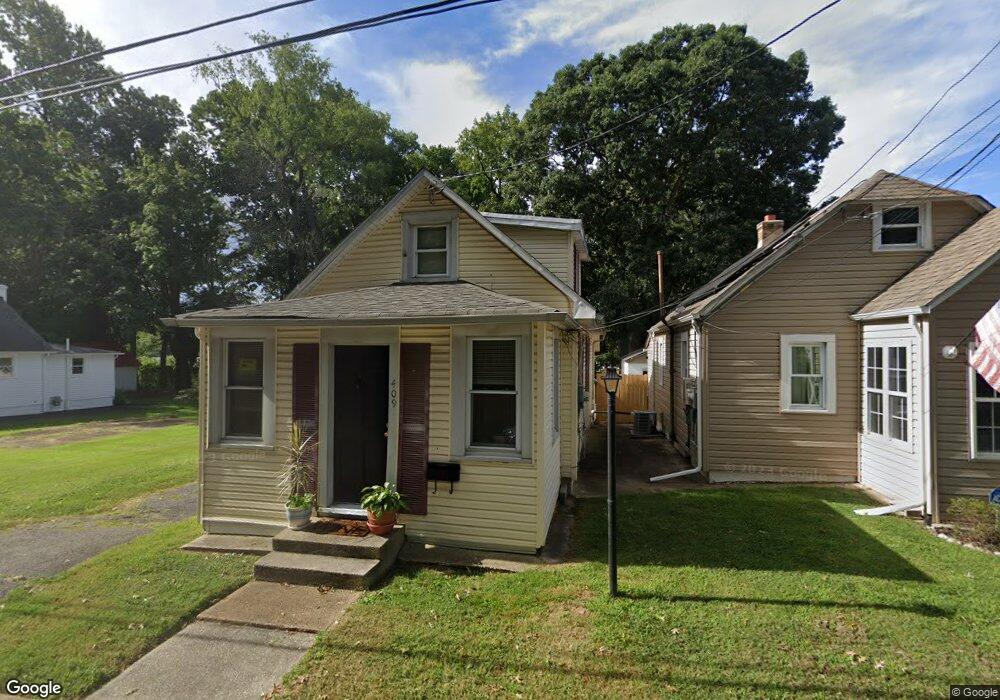
409 11th St New Castle, DE 19720
Minquadale NeighborhoodEstimated Value: $233,000 - $275,334
2
Beds
1
Bath
918
Sq Ft
$269/Sq Ft
Est. Value
About This Home
This home is located at 409 11th St, New Castle, DE 19720 and is currently estimated at $247,084, approximately $269 per square foot. 409 11th St is a home located in New Castle County with nearby schools including Harry O. Eisenberg Elementary School, Calvin R. McCullough Middle School, and Charter School of New Castle.
Ownership History
Date
Name
Owned For
Owner Type
Purchase Details
Closed on
Jun 25, 2021
Sold by
Thomas A Cochran & Sons Inc
Bought by
Salem Hvac Llc
Current Estimated Value
Home Financials for this Owner
Home Financials are based on the most recent Mortgage that was taken out on this home.
Original Mortgage
$130,000
Interest Rate
2.9%
Mortgage Type
Purchase Money Mortgage
Purchase Details
Closed on
Jul 29, 2014
Sold by
Cochran John W and Cochran Marilyn J
Bought by
Thomas A Cochran & Sons Inc
Purchase Details
Closed on
Jul 31, 2009
Sold by
Cochran John W and Cochran Marilyn J
Bought by
Cochran John W and Cochran Marilyn J
Purchase Details
Closed on
May 3, 2007
Sold by
Cochran John W
Bought by
Zebrook Joseph B
Home Financials for this Owner
Home Financials are based on the most recent Mortgage that was taken out on this home.
Original Mortgage
$110,000
Interest Rate
6.23%
Mortgage Type
Seller Take Back
Create a Home Valuation Report for This Property
The Home Valuation Report is an in-depth analysis detailing your home's value as well as a comparison with similar homes in the area
Home Values in the Area
Average Home Value in this Area
Purchase History
| Date | Buyer | Sale Price | Title Company |
|---|---|---|---|
| Salem Hvac Llc | -- | None Available | |
| Thomas A Cochran & Sons Inc | -- | None Available | |
| Cochran John W | $50,000 | None Available | |
| Zebrook Joseph B | $125,000 | None Available |
Source: Public Records
Mortgage History
| Date | Status | Borrower | Loan Amount |
|---|---|---|---|
| Closed | Salem Hvac Llc | $130,000 | |
| Previous Owner | Zebrook Joseph B | $110,000 |
Source: Public Records
Tax History Compared to Growth
Tax History
| Year | Tax Paid | Tax Assessment Tax Assessment Total Assessment is a certain percentage of the fair market value that is determined by local assessors to be the total taxable value of land and additions on the property. | Land | Improvement |
|---|---|---|---|---|
| 2024 | $1,208 | $35,200 | $5,300 | $29,900 |
| 2023 | $1,099 | $35,200 | $5,300 | $29,900 |
| 2022 | $1,144 | $35,200 | $5,300 | $29,900 |
| 2021 | $1,144 | $35,200 | $5,300 | $29,900 |
| 2020 | $1,151 | $35,200 | $5,300 | $29,900 |
| 2019 | $56 | $35,200 | $5,300 | $29,900 |
| 2018 | $69 | $35,200 | $5,300 | $29,900 |
| 2017 | $944 | $35,200 | $5,300 | $29,900 |
| 2016 | $944 | $35,200 | $5,300 | $29,900 |
| 2015 | $944 | $35,200 | $5,300 | $29,900 |
| 2014 | $945 | $35,200 | $5,300 | $29,900 |
Source: Public Records
Map
Nearby Homes
- 800 East Ave
- 701 East Ave
- 203 East Ave
- 204 East Ave
- 212 Lambson Ln
- 106 Killoran Dr
- 119 Riverview Dr
- 39 Memorial Dr
- 323 Sheridan Dr
- 104 Thorn Ln
- 147 Halcyon Dr
- 923 E Hazeldell Ave
- 107 Ryan Ave
- 41 Briarcliff Dr
- 437 Bethune Dr
- 607 1/2 E Hazeldell Ave
- 3100 New Castle Ave
- 420 Robinson Dr
- 168 Edge Ave
- 214 Keiser Place