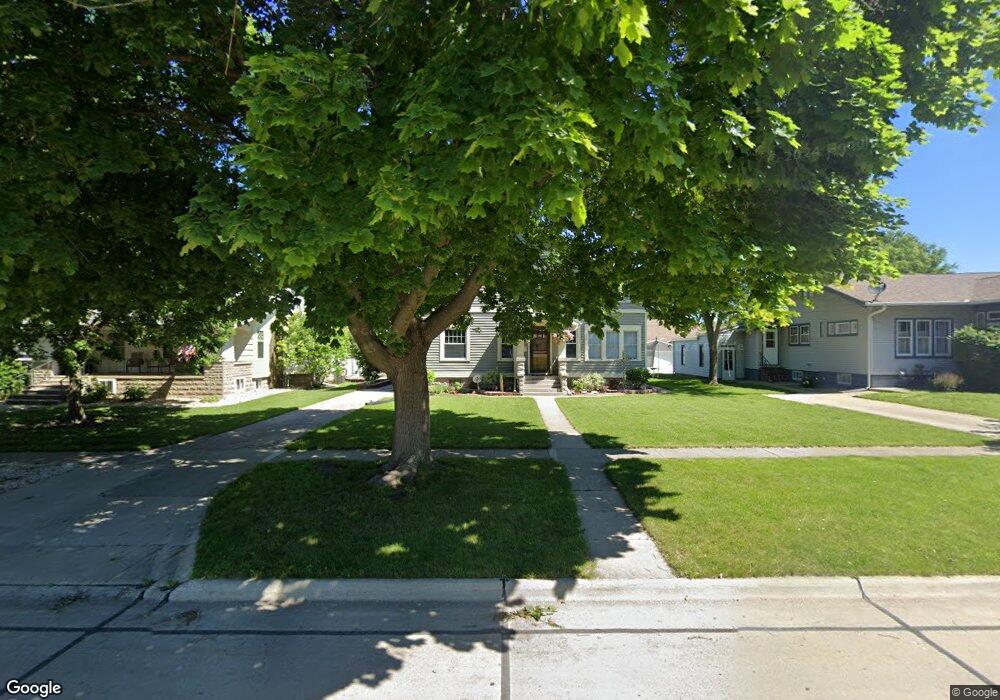
409 2nd Ave NE Clarion, IA 50525
Estimated Value: $153,000 - $196,000
5
Beds
3
Baths
2,183
Sq Ft
$76/Sq Ft
Est. Value
About This Home
This home is located at 409 2nd Ave NE, Clarion, IA 50525 and is currently estimated at $165,803, approximately $75 per square foot. 409 2nd Ave NE is a home located in Wright County with nearby schools including Clarion-Goldfield-Dows Elementary School, Clarion-Goldfield-Dows Middle School, and Clarion-Goldfield-Dows High School.
Ownership History
Date
Name
Owned For
Owner Type
Purchase Details
Closed on
Nov 6, 2008
Sold by
Young Burdette A and Young Bonnie D
Bought by
Johnson Darren Ordean and Johnson Jody
Current Estimated Value
Home Financials for this Owner
Home Financials are based on the most recent Mortgage that was taken out on this home.
Original Mortgage
$82,500
Outstanding Balance
$54,235
Interest Rate
6.11%
Mortgage Type
New Conventional
Estimated Equity
$111,568
Create a Home Valuation Report for This Property
The Home Valuation Report is an in-depth analysis detailing your home's value as well as a comparison with similar homes in the area
Home Values in the Area
Average Home Value in this Area
Purchase History
| Date | Buyer | Sale Price | Title Company |
|---|---|---|---|
| Johnson Darren Ordean | $92,500 | None Available |
Source: Public Records
Mortgage History
| Date | Status | Borrower | Loan Amount |
|---|---|---|---|
| Open | Johnson Darren Ordean | $82,500 |
Source: Public Records
Tax History Compared to Growth
Tax History
| Year | Tax Paid | Tax Assessment Tax Assessment Total Assessment is a certain percentage of the fair market value that is determined by local assessors to be the total taxable value of land and additions on the property. | Land | Improvement |
|---|---|---|---|---|
| 2025 | $2,532 | $131,000 | $9,700 | $121,300 |
| 2024 | $2,532 | $142,400 | $9,700 | $132,700 |
| 2023 | $2,514 | $142,400 | $9,700 | $132,700 |
| 2022 | $2,062 | $120,300 | $9,700 | $110,600 |
| 2021 | $2,062 | $100,500 | $9,700 | $90,800 |
| 2020 | $2,037 | $101,000 | $9,700 | $91,300 |
| 2019 | $1,874 | $92,200 | $0 | $0 |
| 2018 | $1,884 | $92,200 | $0 | $0 |
| 2017 | $1,790 | $88,200 | $0 | $0 |
| 2016 | $1,716 | $88,200 | $0 | $0 |
| 2015 | $1,640 | $88,200 | $0 | $0 |
| 2014 | $1,640 | $91,700 | $0 | $0 |
Source: Public Records
Map
Nearby Homes