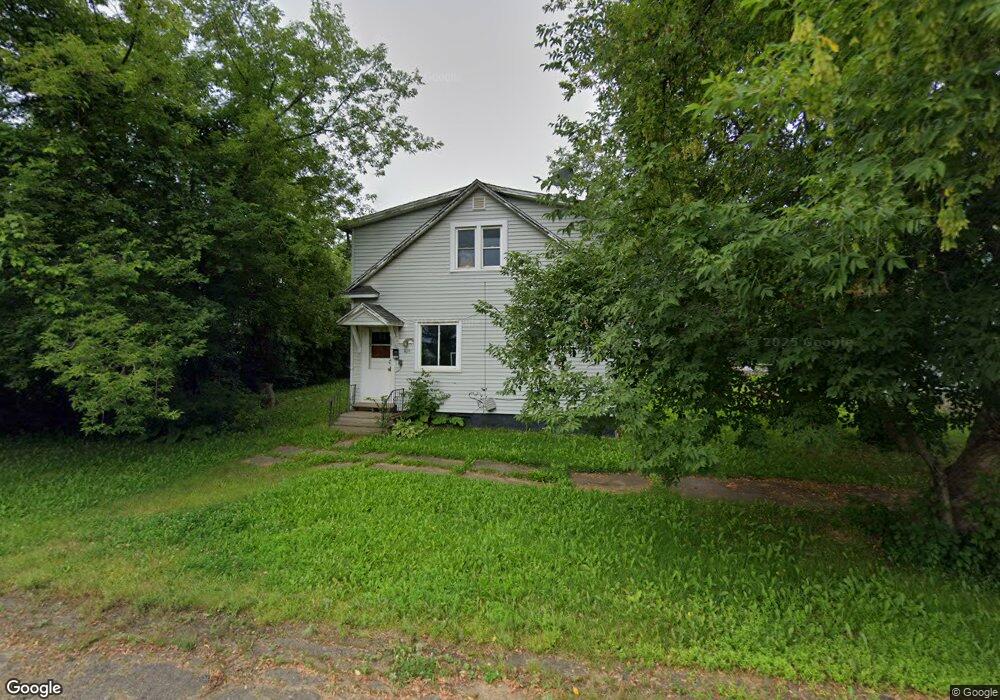
409 2nd St Hibbing, MN 55746
Estimated Value: $88,000 - $114,000
3
Beds
1
Bath
1,296
Sq Ft
$77/Sq Ft
Est. Value
About This Home
This home is located at 409 2nd St, Hibbing, MN 55746 and is currently estimated at $99,494, approximately $76 per square foot. 409 2nd St is a home located in St. Louis County with nearby schools including Washington Elementary School, Lincoln Elementary School, and Hibbing High School.
Ownership History
Date
Name
Owned For
Owner Type
Purchase Details
Closed on
Apr 11, 2019
Sold by
State Of Minnesota
Bought by
Antilla Madelina
Current Estimated Value
Home Financials for this Owner
Home Financials are based on the most recent Mortgage that was taken out on this home.
Original Mortgage
$23,085
Interest Rate
4.4%
Mortgage Type
Land Contract Argmt. Of Sale
Purchase Details
Closed on
Mar 31, 2016
Bought by
Engstrom Angelica Angelica
Home Financials for this Owner
Home Financials are based on the most recent Mortgage that was taken out on this home.
Original Mortgage
$1,940
Interest Rate
3.71%
Purchase Details
Closed on
Mar 29, 2002
Sold by
Gunnerson Richard
Bought by
Engstrom John W
Home Financials for this Owner
Home Financials are based on the most recent Mortgage that was taken out on this home.
Original Mortgage
$49,500
Interest Rate
8.37%
Mortgage Type
Purchase Money Mortgage
Create a Home Valuation Report for This Property
The Home Valuation Report is an in-depth analysis detailing your home's value as well as a comparison with similar homes in the area
Home Values in the Area
Average Home Value in this Area
Purchase History
| Date | Buyer | Sale Price | Title Company |
|---|---|---|---|
| Antilla Madelina | $25,650 | None Available | |
| Engstrom Angelica Angelica | $3,800 | -- | |
| Engstrom John W | -- | -- |
Source: Public Records
Mortgage History
| Date | Status | Borrower | Loan Amount |
|---|---|---|---|
| Closed | Antilla Madelina | $23,085 | |
| Closed | Engstrom Angelica Angelica | $1,940 | |
| Previous Owner | Engstrom John W | $49,500 |
Source: Public Records
Tax History
| Year | Tax Paid | Tax Assessment Tax Assessment Total Assessment is a certain percentage of the fair market value that is determined by local assessors to be the total taxable value of land and additions on the property. | Land | Improvement |
|---|---|---|---|---|
| 2024 | $878 | $55,300 | $13,100 | $42,200 |
| 2023 | $878 | $55,300 | $13,100 | $42,200 |
| 2022 | $800 | $48,600 | $12,000 | $36,600 |
| 2021 | $712 | $44,500 | $11,400 | $33,100 |
| 2020 | $704 | $39,900 | $11,400 | $28,500 |
| 2019 | $0 | $39,900 | $11,400 | $28,500 |
| 2017 | $666 | $39,900 | $11,400 | $28,500 |
| 2016 | $564 | $39,900 | $11,400 | $28,500 |
| 2015 | $606 | $34,200 | $12,400 | $21,800 |
| 2014 | $606 | $36,900 | $12,800 | $24,100 |
Source: Public Records
Map
Nearby Homes
Your Personal Tour Guide
Ask me questions while you tour the home.