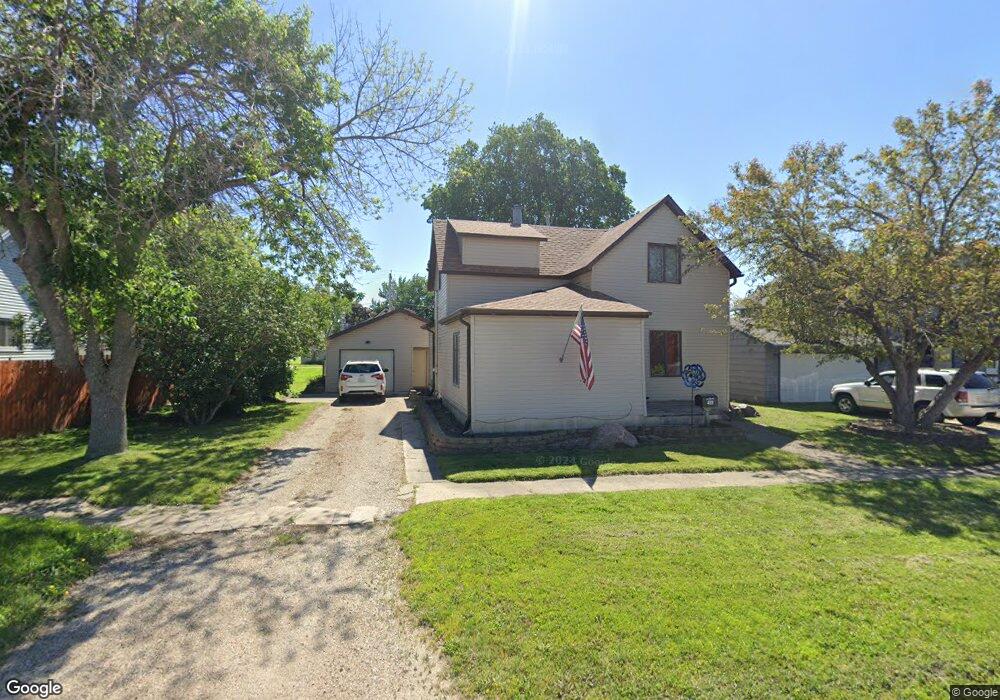
409 2nd St SW Clarion, IA 50525
Estimated Value: $108,000 - $143,627
3
Beds
3
Baths
1,638
Sq Ft
$77/Sq Ft
Est. Value
About This Home
This home is located at 409 2nd St SW, Clarion, IA 50525 and is currently estimated at $125,907, approximately $76 per square foot. 409 2nd St SW is a home located in Wright County with nearby schools including Clarion-Goldfield-Dows Elementary School, Clarion-Goldfield-Dows Middle School, and Clarion-Goldfield-Dows High School.
Ownership History
Date
Name
Owned For
Owner Type
Purchase Details
Closed on
Oct 18, 2021
Sold by
Philbrook Jason R
Bought by
Philbrook Jason R and Philbrook Amber M
Current Estimated Value
Home Financials for this Owner
Home Financials are based on the most recent Mortgage that was taken out on this home.
Original Mortgage
$88,800
Outstanding Balance
$81,222
Interest Rate
3.01%
Mortgage Type
New Conventional
Estimated Equity
$44,685
Purchase Details
Closed on
Oct 27, 2016
Sold by
Anderson Lyon L and Anderson Debra L
Bought by
Philbrook Jason R
Create a Home Valuation Report for This Property
The Home Valuation Report is an in-depth analysis detailing your home's value as well as a comparison with similar homes in the area
Home Values in the Area
Average Home Value in this Area
Purchase History
| Date | Buyer | Sale Price | Title Company |
|---|---|---|---|
| Philbrook Jason R | -- | Servicelink | |
| Philbrook Jason R | -- | Servicelink | |
| Philbrook Jason R | $77,000 | None Available |
Source: Public Records
Mortgage History
| Date | Status | Borrower | Loan Amount |
|---|---|---|---|
| Open | Philbrook Jason R | $88,800 | |
| Closed | Philbrook Jason R | $88,800 |
Source: Public Records
Tax History Compared to Growth
Tax History
| Year | Tax Paid | Tax Assessment Tax Assessment Total Assessment is a certain percentage of the fair market value that is determined by local assessors to be the total taxable value of land and additions on the property. | Land | Improvement |
|---|---|---|---|---|
| 2025 | $2,220 | $119,600 | $6,600 | $113,000 |
| 2024 | $2,220 | $115,900 | $6,600 | $109,300 |
| 2023 | $2,210 | $115,900 | $6,600 | $109,300 |
| 2022 | $1,822 | $96,200 | $6,600 | $89,600 |
| 2021 | $1,822 | $80,900 | $6,600 | $74,300 |
| 2020 | $1,807 | $81,000 | $6,600 | $74,400 |
| 2019 | $1,672 | $74,600 | $0 | $0 |
| 2018 | $1,684 | $74,600 | $0 | $0 |
| 2017 | $1,332 | $71,000 | $0 | $0 |
| 2016 | $1,272 | $71,000 | $0 | $0 |
| 2015 | $1,216 | $71,000 | $0 | $0 |
| 2014 | $1,216 | $68,200 | $0 | $0 |
Source: Public Records
Map
Nearby Homes
- 708 2nd St SW
- 314 1st St NW
- 219 8th Ave SE
- 1000 1st St SE
- 212 3rd Ave NE
- 421 2nd Ave NE
- 614 Central Ave E
- 603 1st Ave NE
- 1221 S Main St
- 213 8th St SE
- 909 1st Ave SE
- 719 2nd St NE
- 903 2nd Ave NE
- 904 3rd Ave NE
- 620 Maple Ln
- 1003 2nd Ave NE
- 306 White Fox Dr
- 2412 188th St
- 2405 186th St Unit 1
- 2405 186th St Unit 2