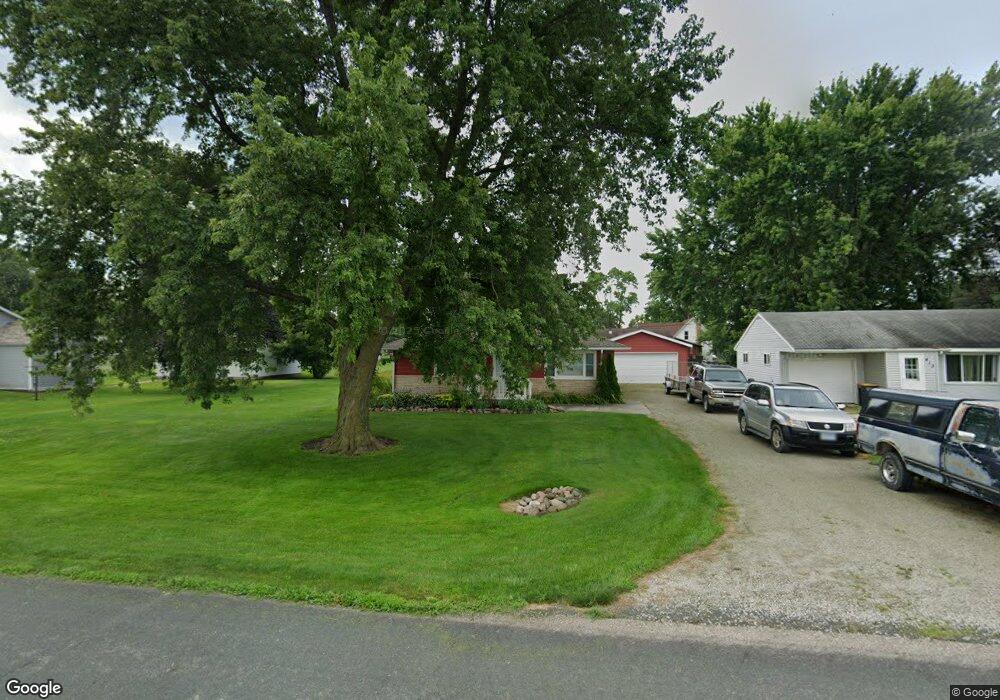
409 3rd St Claremont, MN 55924
Estimated Value: $101,000 - $167,530
2
Beds
1
Bath
1,074
Sq Ft
$123/Sq Ft
Est. Value
About This Home
This home is located at 409 3rd St, Claremont, MN 55924 and is currently estimated at $132,383, approximately $123 per square foot. 409 3rd St is a home located in Dodge County with nearby schools including Triton Elementary School, Triton Middle School, and Triton High School.
Ownership History
Date
Name
Owned For
Owner Type
Purchase Details
Closed on
May 25, 2017
Sold by
Myers Evangeline
Bought by
Huseby Todd
Current Estimated Value
Purchase Details
Closed on
Mar 18, 2016
Sold by
Fate Glenn T and Fate Barbara J
Bought by
Myers Evangeline
Home Financials for this Owner
Home Financials are based on the most recent Mortgage that was taken out on this home.
Original Mortgage
$55,532
Interest Rate
3.72%
Mortgage Type
New Conventional
Purchase Details
Closed on
Sep 16, 2008
Sold by
Emc Mortgage Corporation
Bought by
Fate Barbara J and Fate Glenn T
Home Financials for this Owner
Home Financials are based on the most recent Mortgage that was taken out on this home.
Original Mortgage
$44,000
Interest Rate
6.52%
Mortgage Type
New Conventional
Purchase Details
Closed on
Jun 28, 2005
Sold by
Allan R Radel Homes Inc
Bought by
Overweg Robert L
Create a Home Valuation Report for This Property
The Home Valuation Report is an in-depth analysis detailing your home's value as well as a comparison with similar homes in the area
Home Values in the Area
Average Home Value in this Area
Purchase History
| Date | Buyer | Sale Price | Title Company |
|---|---|---|---|
| Huseby Todd | $59,900 | North American Title | |
| Myers Evangeline | $53,000 | North American Title | |
| Fate Barbara J | $31,500 | Rochester Title | |
| Emc Mortgage Corporation | -- | Rochester Title | |
| Overweg Robert L | $89,900 | Northwest Title |
Source: Public Records
Mortgage History
| Date | Status | Borrower | Loan Amount |
|---|---|---|---|
| Previous Owner | Myers Evangeline | $55,532 | |
| Previous Owner | Fate Barbara J | $44,000 |
Source: Public Records
Tax History Compared to Growth
Tax History
| Year | Tax Paid | Tax Assessment Tax Assessment Total Assessment is a certain percentage of the fair market value that is determined by local assessors to be the total taxable value of land and additions on the property. | Land | Improvement |
|---|---|---|---|---|
| 2025 | $1,784 | $131,600 | $13,100 | $118,500 |
| 2024 | $1,696 | $124,200 | $13,100 | $111,100 |
| 2023 | $1,732 | $113,600 | $13,100 | $100,500 |
| 2022 | $1,518 | $111,600 | $13,100 | $98,500 |
| 2021 | $1,396 | $87,500 | $13,300 | $74,200 |
| 2020 | $1,266 | $81,100 | $13,300 | $67,800 |
| 2019 | $934 | $72,600 | $13,300 | $59,300 |
| 2018 | $1,014 | $59,800 | $13,300 | $46,500 |
| 2017 | $810 | $56,700 | $13,300 | $43,400 |
| 2016 | $1,214 | $53,100 | $13,300 | $39,800 |
| 2015 | $1,148 | $50,800 | $13,300 | $37,500 |
| 2014 | $1,086 | $0 | $0 | $0 |
Source: Public Records
Map
Nearby Homes
- 400 W Front St
- 231 Julia St
- TBD 630th St
- 11TBD 630th St
- 214 4th Place NE
- 5234 SE 74th Ave
- 2651 NE 94th Ave
- 67214 140th Ave
- 1218 Highway St N
- 306 10th Ave NW
- 7793 Austin Rd
- 409 10th St NW
- 406 7th St NW
- 608 3rd Ave NW
- 24 & 28 Main St W
- 12 3rd St SE
- 12TBD Minnesota 56
- 14 4th Ave SE
- 811 1st St NE
- 501 Shady Ln
- 409 409 3rd St W
- 413 3rd St
- 413 413 3rd St W
- 413 413 3rd-Street-w
- 212 212 Wheat-Street-
- 212 212 Wheat St
- 212 Wheat St
- 404 2nd St W
- 412 412 2nd St W
- 412 2nd St W
- 217 217 Oak-Street-
- 217 Oak St
- 400 2nd St W
- 416 2nd St W
- 420 2nd St W
- 416 416 2nd-Street-w
- 215 Wheat St
- 405 2nd St W
- 417 2nd St W
- 413 2nd St W