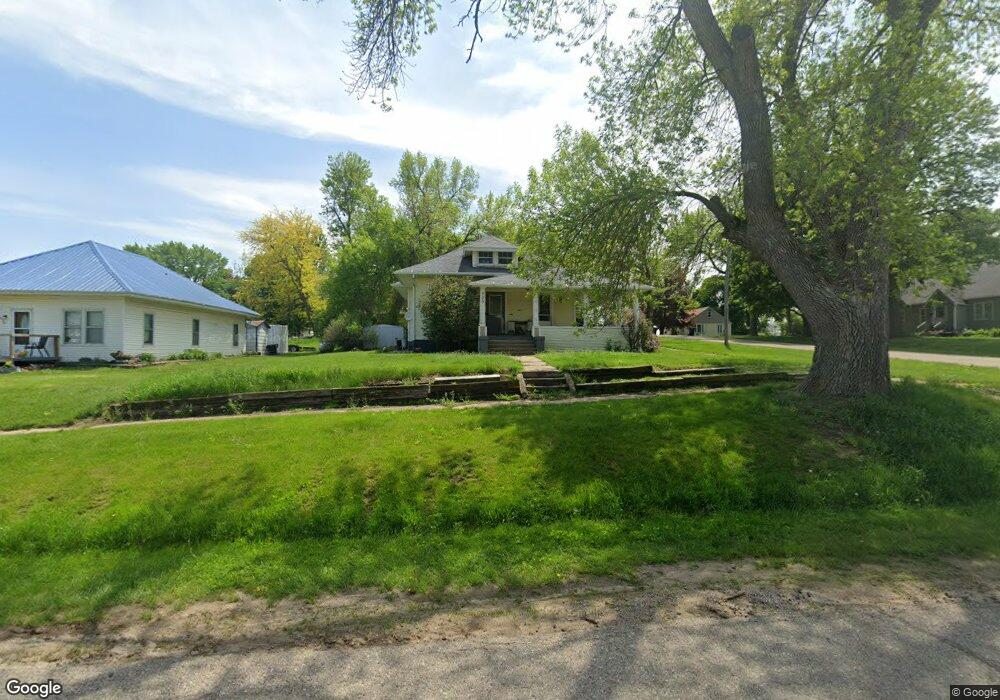
409 3rd St Cushing, IA 51018
Estimated Value: $57,000 - $78,000
3
Beds
1
Bath
1,220
Sq Ft
$58/Sq Ft
Est. Value
About This Home
This home is located at 409 3rd St, Cushing, IA 51018 and is currently estimated at $70,667, approximately $57 per square foot. 409 3rd St is a home with nearby schools including River Valley Elementary School and River Valley Junior/Senior High School.
Ownership History
Date
Name
Owned For
Owner Type
Purchase Details
Closed on
Nov 8, 2016
Sold by
Georgopoulos George A and Georgopoulos Joni L
Bought by
Carstens Christi N
Current Estimated Value
Home Financials for this Owner
Home Financials are based on the most recent Mortgage that was taken out on this home.
Original Mortgage
$279,750
Outstanding Balance
$179,546
Interest Rate
3.47%
Mortgage Type
Closed End Mortgage
Estimated Equity
-$108,879
Create a Home Valuation Report for This Property
The Home Valuation Report is an in-depth analysis detailing your home's value as well as a comparison with similar homes in the area
Purchase History
| Date | Buyer | Sale Price | Title Company |
|---|---|---|---|
| Carstens Christi N | $35,000 | Attorney |
Source: Public Records
Mortgage History
| Date | Status | Borrower | Loan Amount |
|---|---|---|---|
| Open | Carstens Christi N | $279,750 |
Source: Public Records
Tax History
| Year | Tax Paid | Tax Assessment Tax Assessment Total Assessment is a certain percentage of the fair market value that is determined by local assessors to be the total taxable value of land and additions on the property. | Land | Improvement |
|---|---|---|---|---|
| 2025 | $606 | $44,360 | $3,330 | $41,030 |
| 2024 | $620 | $49,180 | $3,330 | $45,850 |
| 2023 | $640 | $49,180 | $3,330 | $45,850 |
| 2022 | $636 | $41,670 | $3,330 | $38,340 |
| 2021 | $636 | $41,670 | $3,330 | $38,340 |
| 2020 | $588 | $39,840 | $3,560 | $36,280 |
| 2019 | $518 | $39,840 | $3,560 | $36,280 |
| 2018 | $510 | $34,670 | $3,560 | $31,110 |
| 2017 | $696 | $34,670 | $3,560 | $31,110 |
| 2016 | $682 | $34,670 | $0 | $0 |
| 2015 | $650 | $32,400 | $3,330 | $29,070 |
| 2014 | $647 | $32,400 | $3,330 | $29,070 |
Source: Public Records
Map
Nearby Homes
Your Personal Tour Guide
Ask me questions while you tour the home.