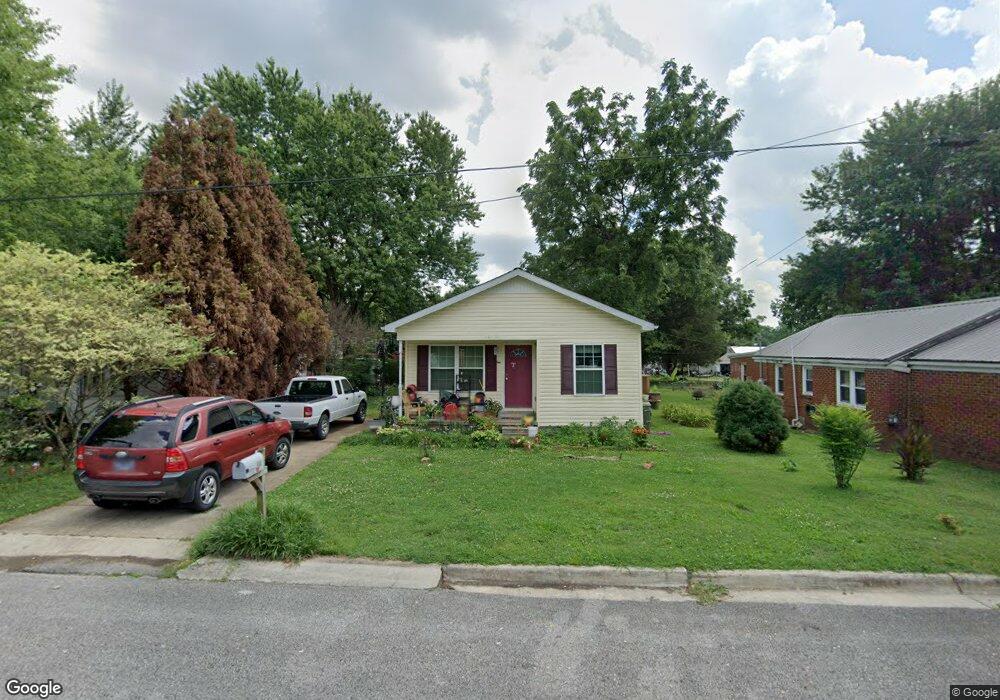
409 6th St Lawrenceburg, TN 38464
Estimated Value: $119,802 - $166,000
--
Bed
1
Bath
904
Sq Ft
$164/Sq Ft
Est. Value
About This Home
This home is located at 409 6th St, Lawrenceburg, TN 38464 and is currently estimated at $147,951, approximately $163 per square foot. 409 6th St is a home located in Lawrence County with nearby schools including Ingram Sowell Elementary School, Lawrenceburg Public Elementary School, and David Crockett Elementary School.
Ownership History
Date
Name
Owned For
Owner Type
Purchase Details
Closed on
Jul 18, 2012
Sold by
Habitat For Humanity Of La
Bought by
Spears Troyce
Current Estimated Value
Home Financials for this Owner
Home Financials are based on the most recent Mortgage that was taken out on this home.
Original Mortgage
$55,500
Outstanding Balance
$38,264
Interest Rate
3.72%
Mortgage Type
Commercial
Estimated Equity
$109,687
Purchase Details
Closed on
Mar 3, 2010
Sold by
Lawrenceburg Federal Bank
Bought by
Habitat For Humanity Of Lawren
Purchase Details
Closed on
Jan 22, 2010
Bought by
Lawrenceburg Federal Bank
Purchase Details
Closed on
Oct 13, 1987
Bought by
Webb Johnny
Purchase Details
Closed on
Jan 1, 1983
Bought by
Anderson Edna M
Purchase Details
Closed on
Jan 1, 1982
Create a Home Valuation Report for This Property
The Home Valuation Report is an in-depth analysis detailing your home's value as well as a comparison with similar homes in the area
Home Values in the Area
Average Home Value in this Area
Purchase History
| Date | Buyer | Sale Price | Title Company |
|---|---|---|---|
| Spears Troyce | $44,771 | -- | |
| Habitat For Humanity Of Lawren | $4,000 | -- | |
| Lawrenceburg Federal Bank | $29,700 | -- | |
| Webb Johnny | -- | -- | |
| Anderson Edna M | $5,000 | -- | |
| -- | $17,000 | -- |
Source: Public Records
Mortgage History
| Date | Status | Borrower | Loan Amount |
|---|---|---|---|
| Open | Spears Troyce | $55,500 |
Source: Public Records
Tax History Compared to Growth
Tax History
| Year | Tax Paid | Tax Assessment Tax Assessment Total Assessment is a certain percentage of the fair market value that is determined by local assessors to be the total taxable value of land and additions on the property. | Land | Improvement |
|---|---|---|---|---|
| 2025 | $718 | $23,100 | $0 | $0 |
| 2024 | $718 | $23,100 | $1,500 | $21,600 |
| 2023 | $718 | $23,100 | $1,500 | $21,600 |
| 2022 | $718 | $23,100 | $1,500 | $21,600 |
| 2021 | $664 | $15,100 | $1,500 | $13,600 |
| 2020 | $664 | $15,100 | $1,500 | $13,600 |
| 2019 | $664 | $15,100 | $1,500 | $13,600 |
| 2018 | $664 | $15,100 | $1,500 | $13,600 |
| 2017 | $664 | $15,100 | $1,500 | $13,600 |
| 2016 | $664 | $15,100 | $1,500 | $13,600 |
| 2015 | $628 | $15,100 | $1,500 | $13,600 |
| 2014 | $577 | $13,875 | $1,500 | $12,375 |
Source: Public Records
Map
Nearby Homes