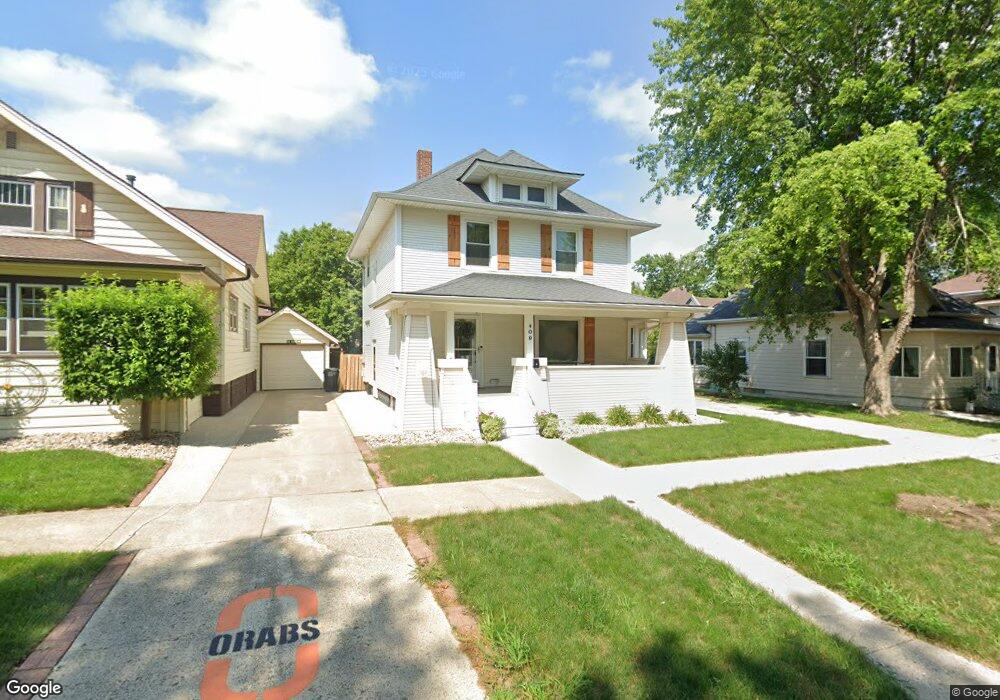
409 8th St Sheldon, IA 51201
Estimated Value: $175,000 - $209,000
3
Beds
3
Baths
2,016
Sq Ft
$96/Sq Ft
Est. Value
About This Home
This home is located at 409 8th St, Sheldon, IA 51201 and is currently estimated at $192,857, approximately $95 per square foot. 409 8th St is a home located in O'Brien County with nearby schools including East Elementary School, Sheldon Middle School, and Sheldon High School.
Ownership History
Date
Name
Owned For
Owner Type
Purchase Details
Closed on
Apr 25, 2024
Sold by
Winchester Rodney W and Winchester Mary J
Bought by
Dejong Cori
Current Estimated Value
Home Financials for this Owner
Home Financials are based on the most recent Mortgage that was taken out on this home.
Original Mortgage
$115,000
Outstanding Balance
$108,538
Interest Rate
6.21%
Mortgage Type
New Conventional
Estimated Equity
$84,319
Purchase Details
Closed on
Aug 11, 2008
Sold by
Harts Kenneeth V and Harts Mary T
Bought by
Winchester Rodney W and Winchester Mary J
Home Financials for this Owner
Home Financials are based on the most recent Mortgage that was taken out on this home.
Original Mortgage
$54,501
Interest Rate
6.39%
Mortgage Type
New Conventional
Create a Home Valuation Report for This Property
The Home Valuation Report is an in-depth analysis detailing your home's value as well as a comparison with similar homes in the area
Home Values in the Area
Average Home Value in this Area
Purchase History
| Date | Buyer | Sale Price | Title Company |
|---|---|---|---|
| Dejong Cori | $180,000 | None Listed On Document | |
| Winchester Rodney W | $99,000 | None Available |
Source: Public Records
Mortgage History
| Date | Status | Borrower | Loan Amount |
|---|---|---|---|
| Open | Dejong Cori | $115,000 | |
| Previous Owner | Winchester Rodney W | $54,501 |
Source: Public Records
Tax History
| Year | Tax Paid | Tax Assessment Tax Assessment Total Assessment is a certain percentage of the fair market value that is determined by local assessors to be the total taxable value of land and additions on the property. | Land | Improvement |
|---|---|---|---|---|
| 2025 | $2,142 | $167,480 | $12,380 | $155,100 |
| 2024 | $2,142 | $140,230 | $12,380 | $127,850 |
| 2023 | $1,980 | $140,230 | $12,380 | $127,850 |
| 2022 | $1,970 | $120,510 | $5,850 | $114,660 |
| 2021 | $1,970 | $120,510 | $5,850 | $114,660 |
| 2020 | $1,964 | $116,670 | $4,950 | $111,720 |
| 2019 | $1,944 | $112,610 | $0 | $0 |
| 2018 | $1,818 | $112,610 | $0 | $0 |
| 2017 | $1,854 | $103,670 | $0 | $0 |
| 2016 | $1,868 | $103,670 | $0 | $0 |
| 2015 | $1,868 | $93,800 | $0 | $0 |
| 2014 | $1,682 | $93,800 | $0 | $0 |
Source: Public Records
Map
Nearby Homes
Your Personal Tour Guide
Ask me questions while you tour the home.