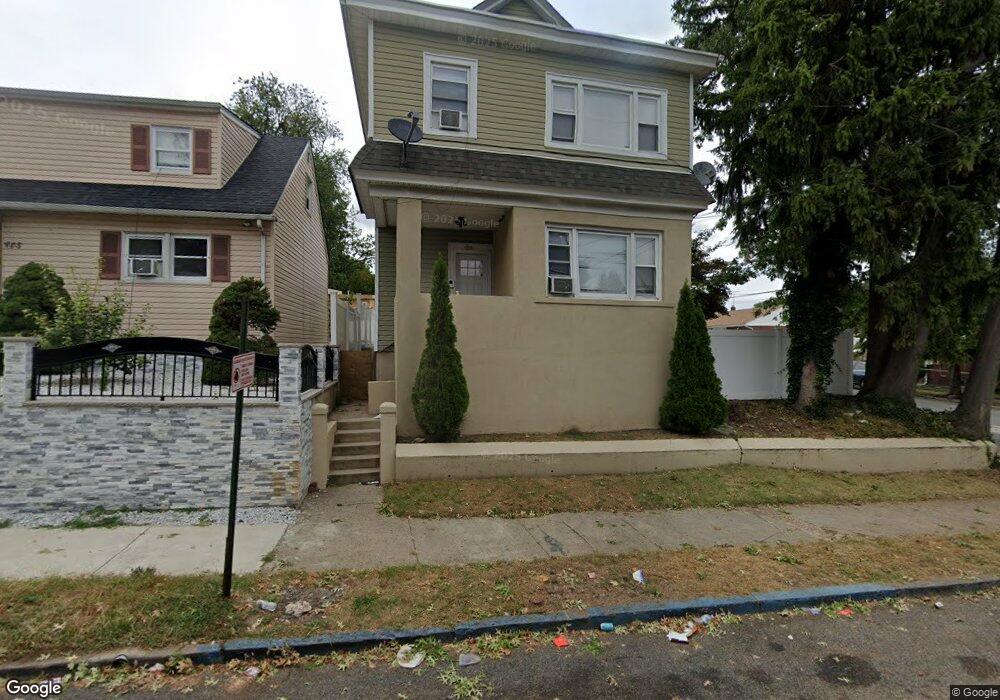
409 9th Ave Unit 411 Paterson, NJ 07514
Riverside NeighborhoodEstimated Value: $607,000 - $764,000
5
Beds
3
Baths
2,191
Sq Ft
$302/Sq Ft
Est. Value
About This Home
This home is located at 409 9th Ave Unit 411, Paterson, NJ 07514 and is currently estimated at $661,016, approximately $301 per square foot. 409 9th Ave Unit 411 is a home located in Passaic County with nearby schools including Edward W. Kilpatrick School of Discovery, Dale Avenue Elementary School, and Paterson School 6.
Ownership History
Date
Name
Owned For
Owner Type
Purchase Details
Closed on
Nov 7, 2018
Sold by
North Jersey Holdings Iv Llc
Bought by
Bailey Tashana and Alexander Tawanashay
Current Estimated Value
Home Financials for this Owner
Home Financials are based on the most recent Mortgage that was taken out on this home.
Original Mortgage
$323,040
Outstanding Balance
$284,071
Interest Rate
4.9%
Mortgage Type
FHA
Estimated Equity
$376,945
Purchase Details
Closed on
Mar 18, 2011
Sold by
Retained Realty Inc
Bought by
North Jersey Holdings Llc
Purchase Details
Closed on
Dec 14, 2009
Sold by
Passaic County Sheriff
Bought by
Retained Realty Inc
Purchase Details
Closed on
Aug 29, 2002
Sold by
Brown Mary
Bought by
Morgan Marie
Purchase Details
Closed on
Oct 3, 2001
Sold by
Hayes Gerald
Bought by
Morgan Marie
Create a Home Valuation Report for This Property
The Home Valuation Report is an in-depth analysis detailing your home's value as well as a comparison with similar homes in the area
Home Values in the Area
Average Home Value in this Area
Purchase History
| Date | Buyer | Sale Price | Title Company |
|---|---|---|---|
| Bailey Tashana | $329,000 | Residential & Commercial Tit | |
| North Jersey Holdings Llc | $110,000 | -- | |
| Retained Realty Inc | $717,568 | -- | |
| Morgan Marie | $40,000 | -- | |
| Morgan Marie | $40,000 | -- |
Source: Public Records
Mortgage History
| Date | Status | Borrower | Loan Amount |
|---|---|---|---|
| Open | Bailey Tashana | $323,040 |
Source: Public Records
Tax History Compared to Growth
Tax History
| Year | Tax Paid | Tax Assessment Tax Assessment Total Assessment is a certain percentage of the fair market value that is determined by local assessors to be the total taxable value of land and additions on the property. | Land | Improvement |
|---|---|---|---|---|
| 2025 | $14,643 | $287,400 | $63,700 | $223,700 |
| 2024 | $14,091 | $287,400 | $63,700 | $223,700 |
| 2022 | $13,341 | $287,400 | $63,700 | $223,700 |
| 2021 | $12,864 | $287,400 | $63,700 | $223,700 |
| 2020 | $11,999 | $287,400 | $63,700 | $223,700 |
| 2019 | $8,557 | $207,000 | $62,500 | $144,500 |
| 2018 | $8,834 | $204,200 | $62,000 | $142,200 |
| 2017 | $8,432 | $202,700 | $61,700 | $141,000 |
| 2016 | $9,095 | $209,600 | $60,500 | $149,100 |
| 2015 | $8,610 | $209,600 | $60,500 | $149,100 |
| 2014 | $10,510 | $362,400 | $170,800 | $191,600 |
Source: Public Records
Map
Nearby Homes
- 312-314 E 27th St
- 358 E 25th St Unit 360
- 294-296 E 27th St
- 294 E 27th St Unit 296
- 310-312 E 26th St
- 410 E 26th St Unit 412
- 383 E 23rd St
- 446 E 24th St
- 276 E 26th St Unit 278
- 466 E 25th St
- 488 - 490 E 25th St
- 488-490 E 25th St
- 447-449 E 27th St
- 474 E 26th St Unit 476
- 501 E 26th St Unit 505
- 501-505 E 26th St
- 313 E 18th St Unit 315
- 297 E 18th St Unit 2
- 235-237 Keen St
- 235 Keen St Unit 237
- 409-411 9th Ave
- 405 9th Ave Unit 407
- 316 E 27th St Unit 320
- 417 9th Ave Unit 419
- 421 9th Ave Unit 423
- 397 9th Ave Unit 399
- 406 9th Ave Unit 408
- 408 9th Ave Unit 412
- 312 E 27th St Unit 314
- 315 E 27th St
- 313 E 27th St Unit 317
- 333 E 26th St Unit 337
- 418 9th Ave Unit 420
- 422 9th Ave Unit 424
- 422-424 9th Ave
- 420 9th Ave Unit 422
- 305 E 27th St Unit 309
- 423 9th Ave Unit 427
- 308 E 27th St Unit 310
- 311 E 27th St