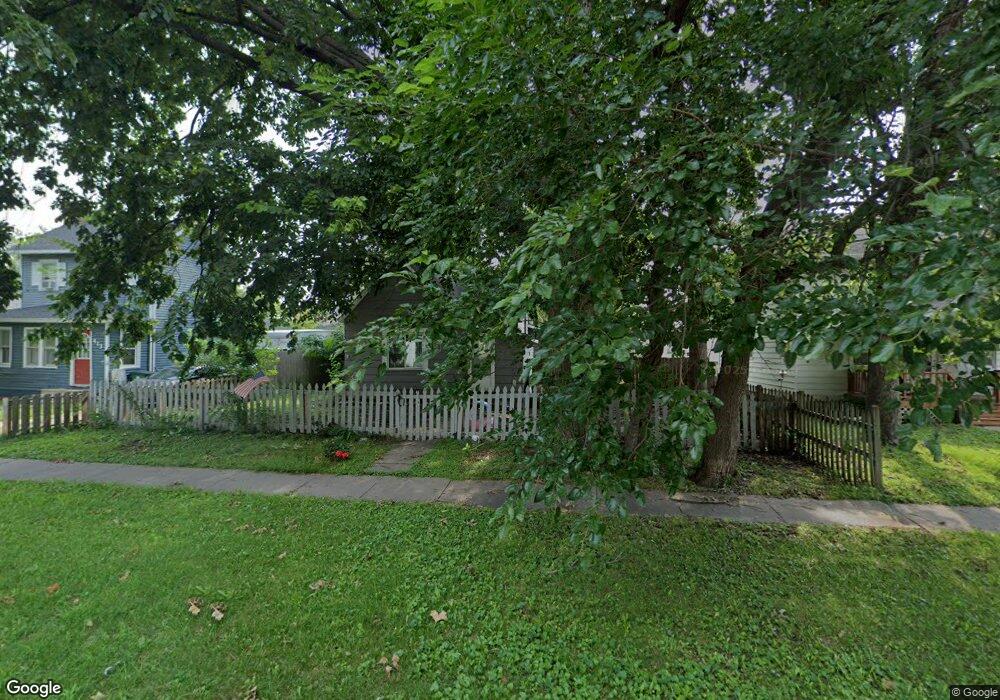
409 9th St West Des Moines, IA 50265
Estimated Value: $159,000 - $201,000
1
Bed
1
Bath
920
Sq Ft
$192/Sq Ft
Est. Value
About This Home
This home is located at 409 9th St, West Des Moines, IA 50265 and is currently estimated at $176,333, approximately $191 per square foot. 409 9th St is a home located in Polk County with nearby schools including Hillside Elementary School, Stilwell Junior High School, and Valley Southwoods Freshman High School.
Ownership History
Date
Name
Owned For
Owner Type
Purchase Details
Closed on
Feb 12, 2007
Sold by
Kern Mark F and Kern Joyce N
Bought by
Oeth Gary
Current Estimated Value
Purchase Details
Closed on
Jan 22, 2007
Sold by
Mccullough Colleen
Bought by
Kern Mark S and Kern Joyce N
Purchase Details
Closed on
Jan 19, 2007
Sold by
Thompson Terry and Thompson Sharon
Bought by
Kern Mark S and Kern Joyce N
Create a Home Valuation Report for This Property
The Home Valuation Report is an in-depth analysis detailing your home's value as well as a comparison with similar homes in the area
Home Values in the Area
Average Home Value in this Area
Purchase History
| Date | Buyer | Sale Price | Title Company |
|---|---|---|---|
| Oeth Gary | $24,500 | Itc | |
| Kern Mark S | -- | Itc | |
| Kern Mark S | -- | Itc |
Source: Public Records
Tax History Compared to Growth
Tax History
| Year | Tax Paid | Tax Assessment Tax Assessment Total Assessment is a certain percentage of the fair market value that is determined by local assessors to be the total taxable value of land and additions on the property. | Land | Improvement |
|---|---|---|---|---|
| 2025 | $1,680 | $114,200 | $45,600 | $68,600 |
| 2024 | $1,680 | $106,000 | $42,300 | $63,700 |
| 2023 | $1,610 | $106,000 | $42,300 | $63,700 |
| 2022 | $1,592 | $83,400 | $34,000 | $49,400 |
| 2021 | $1,502 | $83,400 | $34,000 | $49,400 |
| 2020 | $1,480 | $74,900 | $30,700 | $44,200 |
| 2019 | $1,538 | $74,900 | $30,700 | $44,200 |
| 2018 | $1,462 | $71,200 | $27,200 | $44,000 |
| 2017 | $1,410 | $71,200 | $27,200 | $44,000 |
| 2016 | $1,380 | $66,700 | $25,400 | $41,300 |
| 2015 | $1,380 | $66,700 | $25,400 | $41,300 |
| 2014 | $1,338 | $66,000 | $24,900 | $41,100 |
Source: Public Records
Map
Nearby Homes