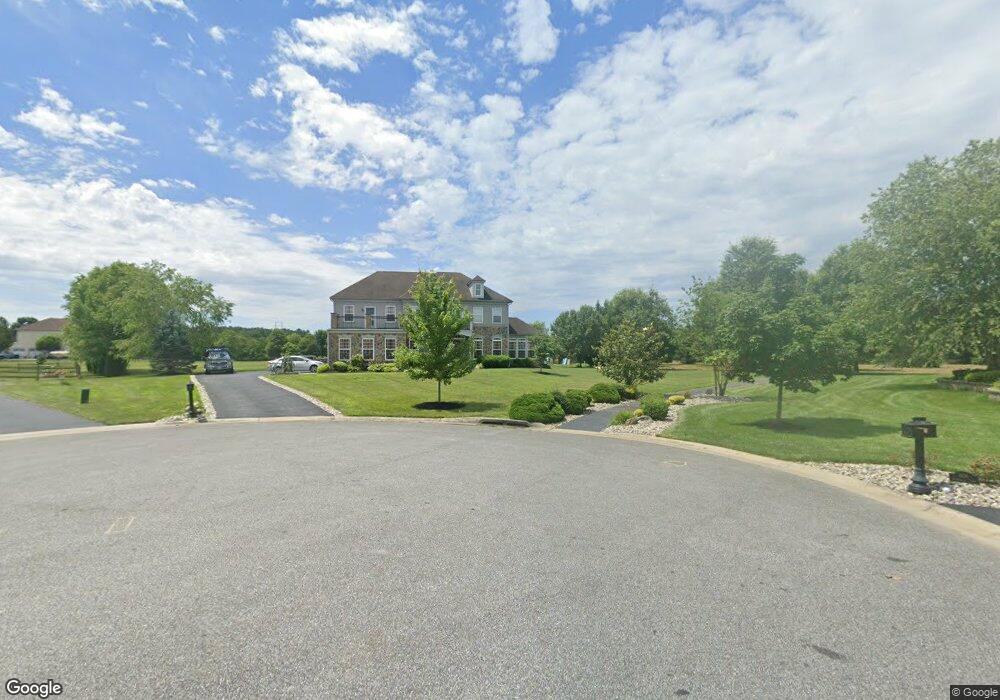
409 Anchorage Ct Newark, DE 19702
Kirkwood NeighborhoodEstimated Value: $874,000 - $963,000
4
Beds
5
Baths
4,046
Sq Ft
$227/Sq Ft
Est. Value
About This Home
This home is located at 409 Anchorage Ct, Newark, DE 19702 and is currently estimated at $918,985, approximately $227 per square foot. 409 Anchorage Ct is a home located in New Castle County with nearby schools including Olive B. Loss Elementary School, Alfred G. Waters Middle School, and Appoquinimink High School.
Ownership History
Date
Name
Owned For
Owner Type
Purchase Details
Closed on
Aug 23, 2007
Sold by
Blenheim Brown Llc
Bought by
Cox Ernest H and Cox Christine
Current Estimated Value
Home Financials for this Owner
Home Financials are based on the most recent Mortgage that was taken out on this home.
Original Mortgage
$521,400
Outstanding Balance
$329,618
Interest Rate
6.63%
Mortgage Type
Negative Amortization
Estimated Equity
$589,367
Create a Home Valuation Report for This Property
The Home Valuation Report is an in-depth analysis detailing your home's value as well as a comparison with similar homes in the area
Home Values in the Area
Average Home Value in this Area
Purchase History
| Date | Buyer | Sale Price | Title Company |
|---|---|---|---|
| Cox Ernest H | $651,753 | None Available |
Source: Public Records
Mortgage History
| Date | Status | Borrower | Loan Amount |
|---|---|---|---|
| Open | Cox Ernest H | $521,400 |
Source: Public Records
Tax History
| Year | Tax Paid | Tax Assessment Tax Assessment Total Assessment is a certain percentage of the fair market value that is determined by local assessors to be the total taxable value of land and additions on the property. | Land | Improvement |
|---|---|---|---|---|
| 2024 | $6,500 | $150,200 | $16,300 | $133,900 |
| 2023 | $5,575 | $150,200 | $16,300 | $133,900 |
| 2022 | $5,590 | $150,200 | $16,300 | $133,900 |
| 2021 | $5,522 | $150,200 | $16,300 | $133,900 |
| 2020 | $5,460 | $150,200 | $16,300 | $133,900 |
| 2019 | $5,072 | $150,200 | $16,300 | $133,900 |
| 2018 | $4,907 | $150,200 | $16,300 | $133,900 |
| 2017 | $4,709 | $150,200 | $16,300 | $133,900 |
| 2016 | $4,286 | $150,200 | $16,300 | $133,900 |
| 2015 | $4,172 | $150,200 | $16,300 | $133,900 |
| 2014 | $4,185 | $150,200 | $16,300 | $133,900 |
Source: Public Records
Map
Nearby Homes
- 200 Testaverde Rd
- 301 E Furrow Ln
- 103 Sarah Cir
- 1 Jasmine Dr
- 34 Brittany Ln
- 29 Sycamore Ln
- 258 Dillon Cir
- 251 Dillon Cir
- 1 Bohemia Rd
- 4 Riva Ridge Ln
- 25 Shawn Ln
- 61 Rose Hill Dr
- 321 Jessica Dr
- 1425 Augustine Herman Hwy
- 2956 Frazer Rd
- 614 Biddle St
- 7 Keeneland Ct
- 2 Pegasus Place
- 19 Radley Run
- 93 W Delaware Canal Ct
Your Personal Tour Guide
Ask me questions while you tour the home.