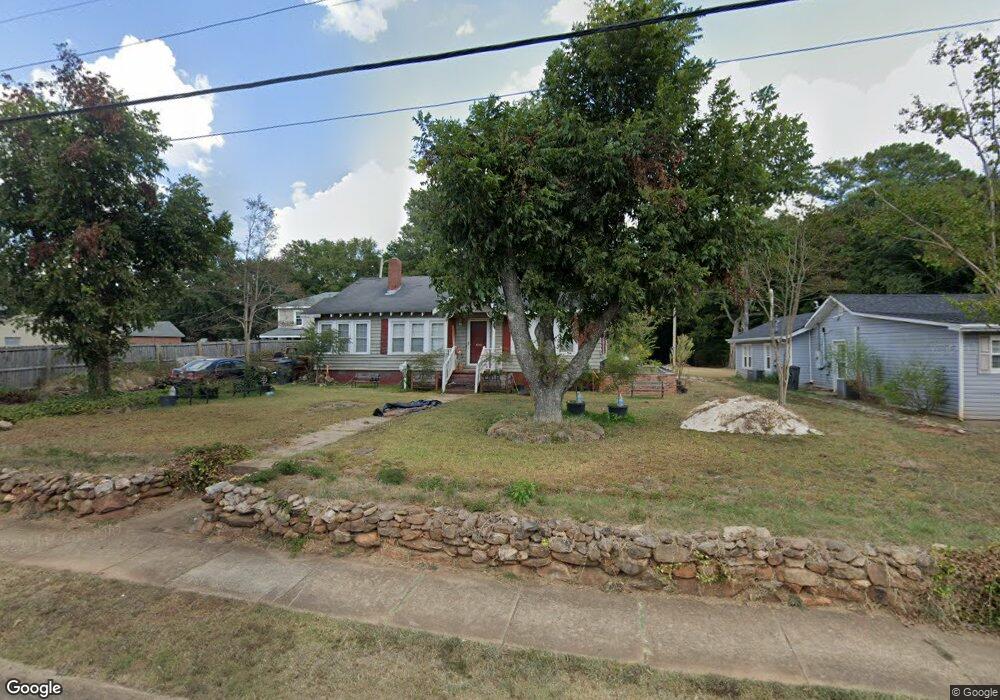
409 Atlanta St Barnesville, GA 30204
Estimated Value: $86,543 - $131,000
2
Beds
1
Bath
1,412
Sq Ft
$74/Sq Ft
Est. Value
About This Home
This home is located at 409 Atlanta St, Barnesville, GA 30204 and is currently estimated at $105,136, approximately $74 per square foot. 409 Atlanta St is a home located in Lamar County with nearby schools including Lamar County Primary School, Lamar County Elementary School, and Lamar County Middle School.
Ownership History
Date
Name
Owned For
Owner Type
Purchase Details
Closed on
Feb 16, 2012
Sold by
Mccreary Valerie
Bought by
Smith George E
Current Estimated Value
Purchase Details
Closed on
Jan 6, 2011
Sold by
Mccreary Richard
Bought by
Mccreary Valerie
Purchase Details
Closed on
Nov 13, 2000
Sold by
Smith George and Smith Sus
Bought by
Mccreary Richard
Purchase Details
Closed on
Aug 10, 1989
Sold by
Gore Dean
Bought by
Smith George and Smith Sus
Create a Home Valuation Report for This Property
The Home Valuation Report is an in-depth analysis detailing your home's value as well as a comparison with similar homes in the area
Home Values in the Area
Average Home Value in this Area
Purchase History
| Date | Buyer | Sale Price | Title Company |
|---|---|---|---|
| Smith George E | $25,000 | -- | |
| Mccreary Valerie | -- | -- | |
| Mccreary Richard | $44,000 | -- | |
| Smith George | $38,500 | -- |
Source: Public Records
Tax History
| Year | Tax Paid | Tax Assessment Tax Assessment Total Assessment is a certain percentage of the fair market value that is determined by local assessors to be the total taxable value of land and additions on the property. | Land | Improvement |
|---|---|---|---|---|
| 2025 | $352 | $23,233 | $3,200 | $20,033 |
| 2024 | $321 | $18,786 | $3,200 | $15,586 |
| 2023 | $362 | $19,761 | $3,200 | $16,561 |
| 2022 | $423 | $17,223 | $3,200 | $14,023 |
| 2021 | $361 | $13,918 | $3,200 | $10,718 |
| 2020 | $332 | $12,402 | $3,200 | $9,202 |
| 2019 | $333 | $12,402 | $3,200 | $9,202 |
| 2018 | $307 | $11,991 | $3,200 | $8,791 |
| 2017 | $306 | $11,991 | $3,200 | $8,791 |
| 2016 | $307 | $11,991 | $3,200 | $8,791 |
| 2015 | $442 | $14,600 | $3,200 | $11,400 |
| 2014 | $428 | $14,600 | $3,200 | $11,400 |
| 2013 | -- | $20,600 | $9,200 | $11,400 |
Source: Public Records
Map
Nearby Homes
- 163 Grove St
- 339 Atlanta St
- 149 Akins St
- 121 Westchester Dr
- 250 Mill St
- 407 Westchester Dr
- 13 Brown St
- 107 1st St
- 7 Jackson St
- 178 Barnesville Ave
- 0 Washington St Unit 10710879
- 109 Barnesville Ave
- 144 U S 341
- 531 Thomaston St
- 149 Holmes St
- 642 Greenwood St
- 114 Stafford Ave
- 147 Stafford Ave
- 275 Rose Ave
- 503 Forsyth St
Your Personal Tour Guide
Ask me questions while you tour the home.