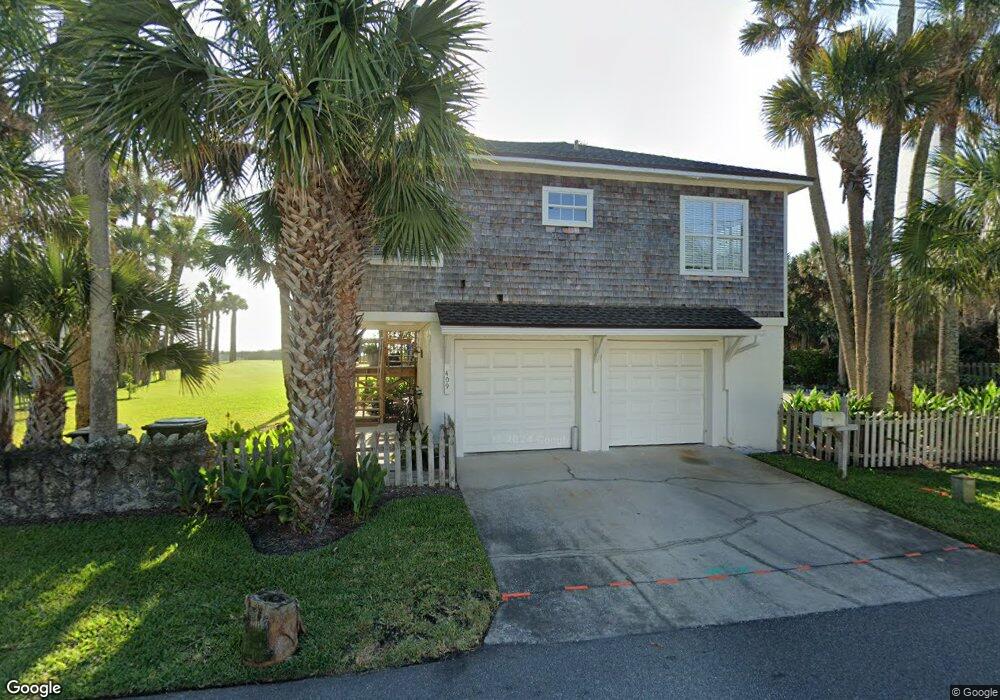
409 Beach Ave Atlantic Beach, FL 32233
Estimated Value: $3,153,000 - $7,232,000
2
Beds
1
Bath
850
Sq Ft
$6,892/Sq Ft
Est. Value
About This Home
This home is located at 409 Beach Ave, Atlantic Beach, FL 32233 and is currently estimated at $5,858,166, approximately $6,891 per square foot. 409 Beach Ave is a home located in Duval County with nearby schools including Atlantic Beach Elementary School, Mayport Middle School, and Duncan U. Fletcher High School.
Ownership History
Date
Name
Owned For
Owner Type
Purchase Details
Closed on
Mar 1, 2024
Sold by
Hughston Jack
Bought by
Ftp Investments Llc
Current Estimated Value
Purchase Details
Closed on
Feb 28, 2022
Sold by
Atlantic Beach Llc
Bought by
Hughston Jack
Home Financials for this Owner
Home Financials are based on the most recent Mortgage that was taken out on this home.
Original Mortgage
$3,675,000
Interest Rate
3.89%
Mortgage Type
New Conventional
Purchase Details
Closed on
Aug 1, 2018
Sold by
Wells Fargo Bank Na and Dodelin Fred
Bought by
Atlantic Beach Llc
Create a Home Valuation Report for This Property
The Home Valuation Report is an in-depth analysis detailing your home's value as well as a comparison with similar homes in the area
Home Values in the Area
Average Home Value in this Area
Purchase History
| Date | Buyer | Sale Price | Title Company |
|---|---|---|---|
| Ftp Investments Llc | $100 | None Listed On Document | |
| Ftp Investments Llc | $100 | None Listed On Document | |
| Hughston Jack | $5,250,000 | Landmark Title | |
| Atlantic Beach Llc | $1,050,000 | Attorney | |
| Atlantic Beach Llc | -- | Attorney | |
| Hughston Sarah H | -- | Attorney |
Source: Public Records
Mortgage History
| Date | Status | Borrower | Loan Amount |
|---|---|---|---|
| Previous Owner | Hughston Jack | $3,675,000 |
Source: Public Records
Tax History
| Year | Tax Paid | Tax Assessment Tax Assessment Total Assessment is a certain percentage of the fair market value that is determined by local assessors to be the total taxable value of land and additions on the property. | Land | Improvement |
|---|---|---|---|---|
| 2026 | $125,150 | $7,270,532 | $6,689,912 | $580,620 |
| 2025 | $128,332 | $7,366,391 | $6,835,260 | $531,131 |
| 2024 | $119,972 | $7,368,897 | $6,831,450 | $537,447 |
| 2023 | $119,972 | $6,853,049 | $6,327,000 | $526,049 |
| 2022 | $88,808 | $5,746,086 | $5,472,000 | $274,086 |
| 2021 | $79,965 | $4,585,516 | $4,360,500 | $225,016 |
| 2020 | $75,789 | $4,319,568 | $4,104,000 | $215,568 |
| 2019 | $70,785 | $3,975,989 | $3,762,000 | $213,989 |
| 2018 | $71,483 | $3,979,944 | $3,762,000 | $217,944 |
| 2017 | $66,469 | $3,658,345 | $3,420,000 | $238,345 |
| 2016 | $67,435 | $3,644,695 | $0 | $0 |
| 2015 | $65,430 | $3,616,018 | $0 | $0 |
| 2014 | $62,458 | $3,603,183 | $0 | $0 |
Source: Public Records
Map
Nearby Homes
- 517 Beach Ave
- 211 Beach Ave
- 350 4th St
- 711 Ocean Blvd
- 701 Beach Ave Unit 301
- 145 8th St
- 851 Beach Ave
- 130 Club Dr
- 399 Ahern St
- 365 8th St
- 181 Sylvan Dr
- 760 Sherry Dr
- 740 Sherry Dr
- 340 9th St
- 901 Ocean Blvd Unit 1
- 901 Ocean Blvd Unit 92
- 10 10th St Unit 2
- 144 Poinsettia St
- 1025 Beach Ave
- 1039 Beach Ave
Your Personal Tour Guide
Ask me questions while you tour the home.