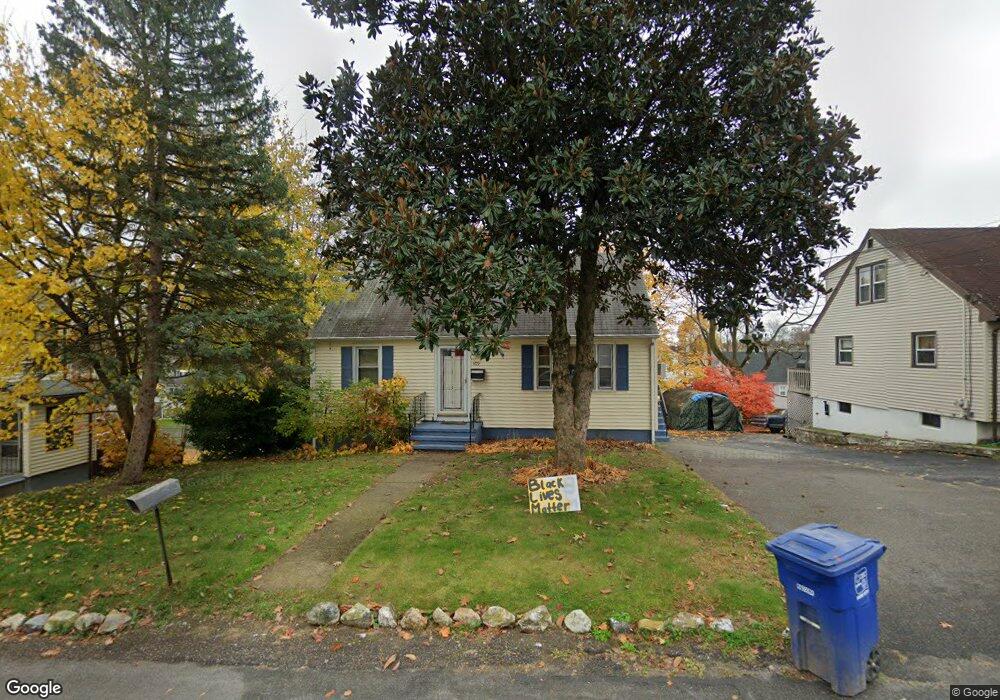
409 Birmingham St Bridgeport, CT 06606
North End NeighborhoodEstimated Value: $332,000 - $423,000
4
Beds
1
Bath
1,224
Sq Ft
$317/Sq Ft
Est. Value
About This Home
This home is located at 409 Birmingham St, Bridgeport, CT 06606 and is currently estimated at $387,577, approximately $316 per square foot. 409 Birmingham St is a home located in Fairfield County with nearby schools including Blackham School, Central High School, and St Andrew School.
Ownership History
Date
Name
Owned For
Owner Type
Purchase Details
Closed on
Mar 8, 2004
Sold by
Willis Essie
Bought by
Johnson Karen
Current Estimated Value
Home Financials for this Owner
Home Financials are based on the most recent Mortgage that was taken out on this home.
Original Mortgage
$142,100
Interest Rate
5.62%
Create a Home Valuation Report for This Property
The Home Valuation Report is an in-depth analysis detailing your home's value as well as a comparison with similar homes in the area
Home Values in the Area
Average Home Value in this Area
Purchase History
| Date | Buyer | Sale Price | Title Company |
|---|---|---|---|
| Johnson Karen | $170,000 | -- | |
| Johnson Karen | $170,000 | -- |
Source: Public Records
Mortgage History
| Date | Status | Borrower | Loan Amount |
|---|---|---|---|
| Open | Johnson Karen | $171,200 | |
| Closed | Johnson Karen | $142,100 |
Source: Public Records
Tax History Compared to Growth
Tax History
| Year | Tax Paid | Tax Assessment Tax Assessment Total Assessment is a certain percentage of the fair market value that is determined by local assessors to be the total taxable value of land and additions on the property. | Land | Improvement |
|---|---|---|---|---|
| 2025 | $6,798 | $156,460 | $76,310 | $80,150 |
| 2024 | $6,798 | $156,460 | $76,310 | $80,150 |
| 2023 | $6,798 | $156,460 | $76,310 | $80,150 |
| 2022 | $6,798 | $156,460 | $76,310 | $80,150 |
| 2021 | $6,798 | $156,460 | $76,310 | $80,150 |
| 2020 | $5,996 | $111,050 | $43,840 | $67,210 |
| 2019 | $5,996 | $111,050 | $43,840 | $67,210 |
| 2018 | $6,038 | $111,050 | $43,840 | $67,210 |
| 2017 | $6,038 | $111,050 | $43,840 | $67,210 |
| 2016 | $6,038 | $111,050 | $43,840 | $67,210 |
| 2015 | $5,842 | $138,440 | $50,650 | $87,790 |
| 2014 | $5,842 | $138,440 | $50,650 | $87,790 |
Source: Public Records
Map
Nearby Homes
- 214 Burnsford Ave
- 260 Birmingham St
- 184 Merritt St
- 604 Birmingham St
- 113 Clark St
- 375 Ruth St
- 339 Goldenrod Ave
- 376 Savoy St
- 605 Merritt St
- 520 Savoy St
- 234 Savoy St
- 1095 Wayne St
- 3401 Main St
- 485 Westfield Ave
- 38 Enid St Unit B
- 245 Glendale Ave Unit D8
- 354 Beechmont Ave
- 631 Fairview Ave
- 495 Peet St
- 720 Queen St
- 427 Birmingham St
- 393 Birmingham St
- 316 Clark St
- 324 Clark St
- 431 Birmingham St
- 383 Birmingham St
- 340 Clark St
- 410 Birmingham St
- 420 Birmingham St
- 300 Clark St
- 400 Birmingham St
- 350 Clark St
- 449 Birmingham St
- 446 Birmingham St
- 360 Clark St
- 450 Birmingham St
- 365 Birmingham St
- 439 Birmingham St
- 325 Burnsford Ave
- 315 Burnsford Ave