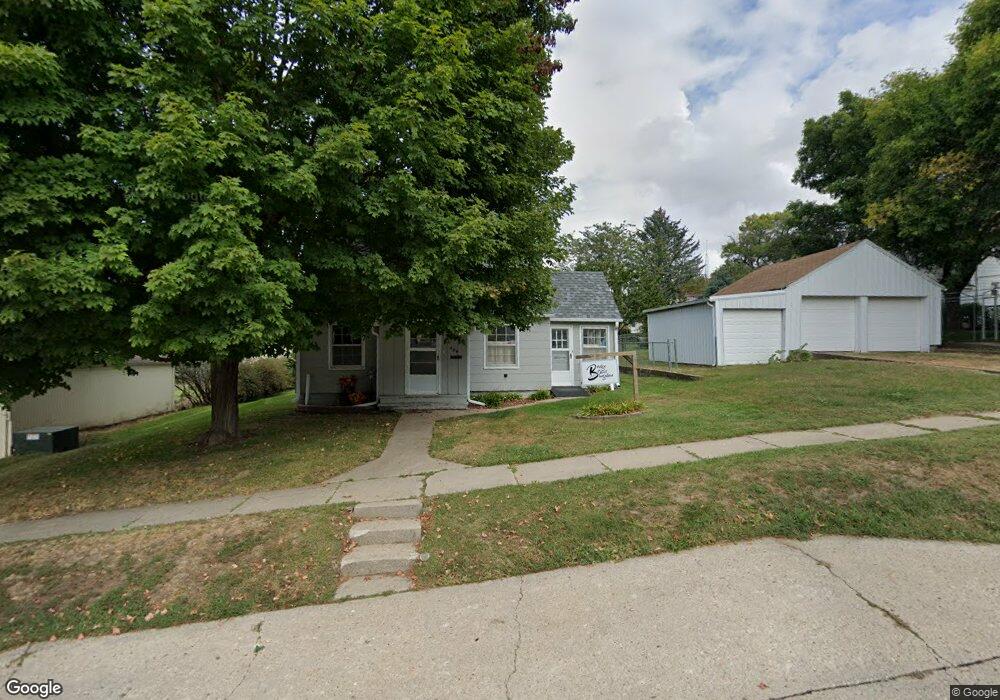
409 Bridge St Coon Rapids, IA 50058
Estimated Value: $83,933 - $122,000
2
Beds
1
Bath
1,003
Sq Ft
$103/Sq Ft
Est. Value
About This Home
This home is located at 409 Bridge St, Coon Rapids, IA 50058 and is currently estimated at $102,983, approximately $102 per square foot. 409 Bridge St is a home.
Ownership History
Date
Name
Owned For
Owner Type
Purchase Details
Closed on
Apr 20, 2018
Sold by
United Bank Of Iowa
Bought by
Sanden Cory and Sanden Keely
Current Estimated Value
Home Financials for this Owner
Home Financials are based on the most recent Mortgage that was taken out on this home.
Original Mortgage
$27,661
Outstanding Balance
$23,805
Interest Rate
4.47%
Estimated Equity
$79,178
Purchase Details
Closed on
Nov 4, 2011
Sold by
Estate Of James L Namanny
Bought by
Anthofer Robby J
Home Financials for this Owner
Home Financials are based on the most recent Mortgage that was taken out on this home.
Original Mortgage
$32,400
Interest Rate
4.09%
Mortgage Type
New Conventional
Create a Home Valuation Report for This Property
The Home Valuation Report is an in-depth analysis detailing your home's value as well as a comparison with similar homes in the area
Home Values in the Area
Average Home Value in this Area
Purchase History
| Date | Buyer | Sale Price | Title Company |
|---|---|---|---|
| Sanden Cory | -- | -- | |
| Anthofer Robby J | $30,000 | None Available |
Source: Public Records
Mortgage History
| Date | Status | Borrower | Loan Amount |
|---|---|---|---|
| Open | Sanden Cory | $27,661 | |
| Closed | Sanden Cory | -- | |
| Previous Owner | Anthofer Robby J | $32,400 |
Source: Public Records
Tax History Compared to Growth
Tax History
| Year | Tax Paid | Tax Assessment Tax Assessment Total Assessment is a certain percentage of the fair market value that is determined by local assessors to be the total taxable value of land and additions on the property. | Land | Improvement |
|---|---|---|---|---|
| 2025 | $786 | $66,690 | $8,180 | $58,510 |
| 2024 | $786 | $53,440 | $8,180 | $45,260 |
| 2023 | $826 | $53,440 | $8,180 | $45,260 |
| 2022 | $804 | $47,660 | $7,010 | $40,650 |
| 2021 | $804 | $47,660 | $7,010 | $40,650 |
| 2020 | $816 | $47,660 | $7,010 | $40,650 |
| 2019 | $816 | $46,720 | $0 | $0 |
| 2018 | $644 | $47,660 | $7,010 | $40,650 |
| 2017 | $644 | $46,716 | $5,500 | $41,216 |
| 2016 | $574 | $43,660 | $0 | $0 |
| 2015 | $574 | $44,140 | $0 | $0 |
| 2014 | $596 | $44,140 | $0 | $0 |
Source: Public Records
Map
Nearby Homes