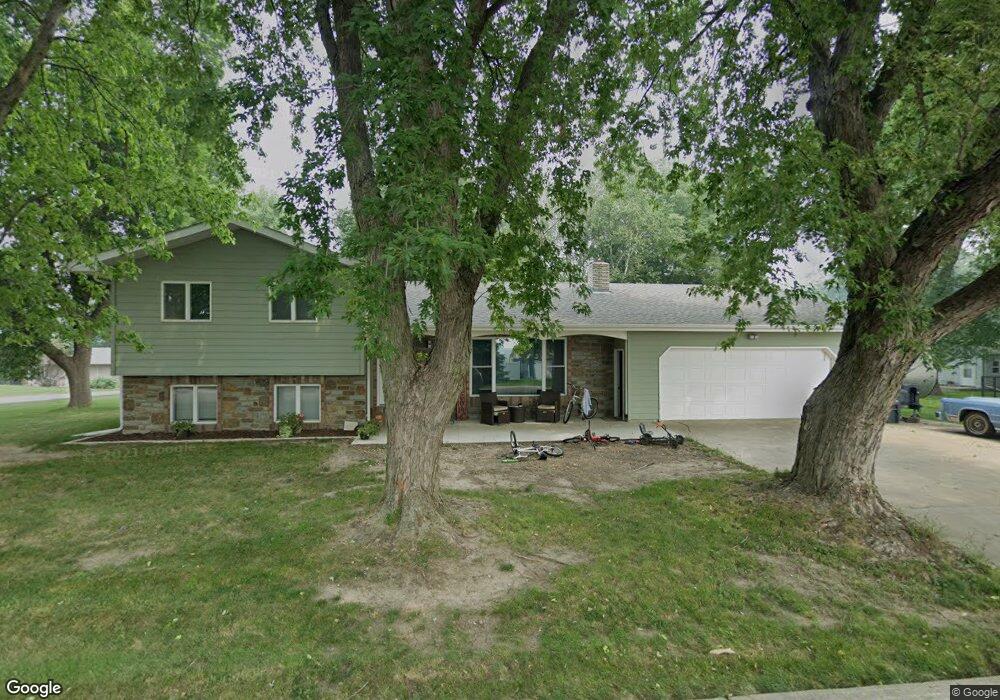
409 Brown St Larchwood, IA 51241
Estimated Value: $278,326 - $438,000
--
Bed
1
Bath
1,512
Sq Ft
$214/Sq Ft
Est. Value
About This Home
This home is located at 409 Brown St, Larchwood, IA 51241 and is currently estimated at $323,582, approximately $214 per square foot. 409 Brown St is a home located in Lyon County with nearby schools including West Lyon Elementary School, West Lyon Junior High School, and West Lyon High School.
Ownership History
Date
Name
Owned For
Owner Type
Purchase Details
Closed on
Dec 5, 2020
Sold by
Vanden Bosch Shannon and Vanden Dominic
Bought by
Engen Nicolas R Van and Vanengen Shirley Van
Current Estimated Value
Purchase Details
Closed on
Aug 1, 2007
Sold by
Bontje Shirley A
Bought by
Bosch Dominic D Vanden and Bosch Shannon M Vanden
Home Financials for this Owner
Home Financials are based on the most recent Mortgage that was taken out on this home.
Original Mortgage
$144,000
Interest Rate
6.69%
Mortgage Type
New Conventional
Create a Home Valuation Report for This Property
The Home Valuation Report is an in-depth analysis detailing your home's value as well as a comparison with similar homes in the area
Home Values in the Area
Average Home Value in this Area
Purchase History
| Date | Buyer | Sale Price | Title Company |
|---|---|---|---|
| Engen Nicolas R Van | $325,000 | None Listed On Document | |
| Bosch Dominic D Vanden | $160,000 | None Available |
Source: Public Records
Mortgage History
| Date | Status | Borrower | Loan Amount |
|---|---|---|---|
| Previous Owner | Bosch Dominic D Vanden | $144,000 |
Source: Public Records
Tax History Compared to Growth
Tax History
| Year | Tax Paid | Tax Assessment Tax Assessment Total Assessment is a certain percentage of the fair market value that is determined by local assessors to be the total taxable value of land and additions on the property. | Land | Improvement |
|---|---|---|---|---|
| 2025 | $3,060 | $302,110 | $29,020 | $273,090 |
| 2024 | $3,060 | $255,770 | $29,020 | $226,750 |
| 2023 | $3,178 | $255,770 | $29,020 | $226,750 |
| 2022 | $2,888 | $204,430 | $29,020 | $175,410 |
| 2021 | $2,888 | $204,430 | $29,020 | $175,410 |
| 2020 | $2,506 | $199,770 | $20,250 | $179,520 |
| 2019 | $2,476 | $192,996 | $0 | $0 |
| 2018 | $2,434 | $192,996 | $0 | $0 |
| 2017 | $2,434 | $163,353 | $0 | $0 |
| 2016 | $2,000 | $163,353 | $0 | $0 |
| 2015 | $2,000 | $165,145 | $0 | $0 |
| 2014 | $1,986 | $165,145 | $0 | $0 |
Source: Public Records
Map
Nearby Homes