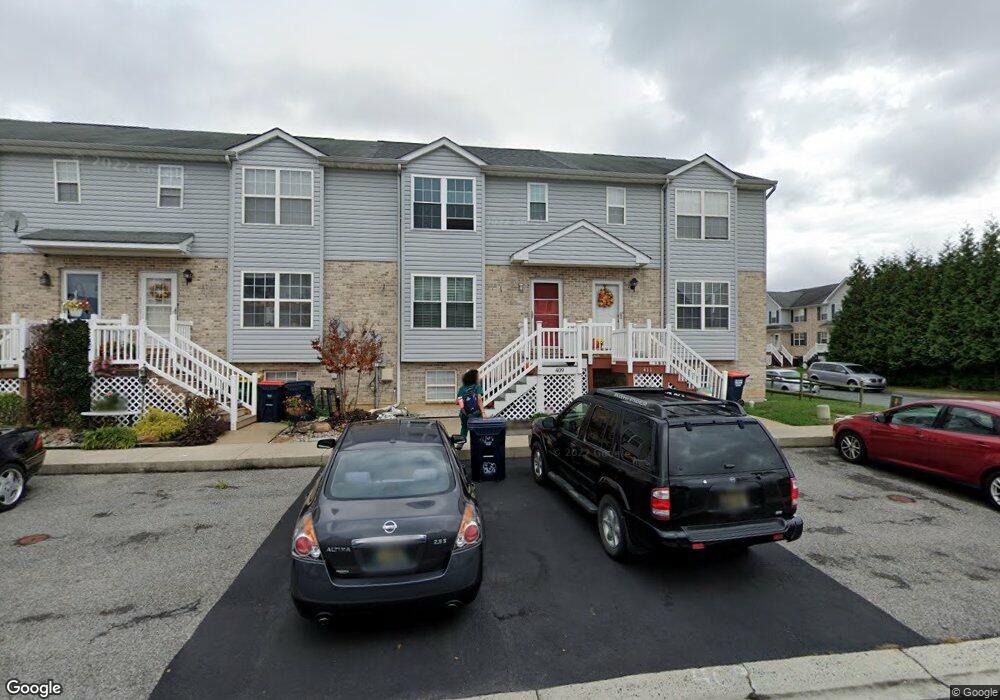
409 Champs Ln Middletown, DE 19709
Estimated Value: $263,000 - $279,000
3
Beds
3
Baths
1,200
Sq Ft
$225/Sq Ft
Est. Value
About This Home
This home is located at 409 Champs Ln, Middletown, DE 19709 and is currently estimated at $269,681, approximately $224 per square foot. 409 Champs Ln is a home located in New Castle County with nearby schools including Bunker Hill Elementary School, Everett Meredith Middle School, and Appoquinimink High School.
Ownership History
Date
Name
Owned For
Owner Type
Purchase Details
Closed on
Mar 22, 2022
Sold by
Stephanie Lue
Bought by
Luc Stephanie and Short Stephanie
Current Estimated Value
Home Financials for this Owner
Home Financials are based on the most recent Mortgage that was taken out on this home.
Original Mortgage
$146,500
Outstanding Balance
$127,464
Interest Rate
3.39%
Mortgage Type
New Conventional
Estimated Equity
$142,217
Purchase Details
Closed on
Nov 16, 2005
Sold by
Richardson Thomas A
Bought by
Short Stephanie
Home Financials for this Owner
Home Financials are based on the most recent Mortgage that was taken out on this home.
Original Mortgage
$179,900
Interest Rate
6.06%
Mortgage Type
Fannie Mae Freddie Mac
Purchase Details
Closed on
Dec 23, 2002
Sold by
Lenape Homes Inc
Bought by
Richardson Thomas A
Home Financials for this Owner
Home Financials are based on the most recent Mortgage that was taken out on this home.
Original Mortgage
$115,050
Interest Rate
6.19%
Mortgage Type
FHA
Create a Home Valuation Report for This Property
The Home Valuation Report is an in-depth analysis detailing your home's value as well as a comparison with similar homes in the area
Home Values in the Area
Average Home Value in this Area
Purchase History
| Date | Buyer | Sale Price | Title Company |
|---|---|---|---|
| Luc Stephanie | -- | None Listed On Document | |
| Short Stephanie | $179,900 | -- | |
| Richardson Thomas A | $115,985 | -- |
Source: Public Records
Mortgage History
| Date | Status | Borrower | Loan Amount |
|---|---|---|---|
| Open | Luc Stephanie | $146,500 | |
| Previous Owner | Short Stephanie | $179,900 | |
| Previous Owner | Richardson Thomas A | $115,050 | |
| Closed | Richardson Thomas A | $8,401 |
Source: Public Records
Tax History
| Year | Tax Paid | Tax Assessment Tax Assessment Total Assessment is a certain percentage of the fair market value that is determined by local assessors to be the total taxable value of land and additions on the property. | Land | Improvement |
|---|---|---|---|---|
| 2024 | $124 | $41,400 | $3,300 | $38,100 |
| 2023 | $124 | $41,400 | $3,300 | $38,100 |
| 2022 | $1,273 | $41,400 | $3,300 | $38,100 |
| 2021 | $1,245 | $41,400 | $3,300 | $38,100 |
| 2020 | $1,230 | $41,400 | $3,300 | $38,100 |
| 2019 | $1,264 | $41,400 | $3,300 | $38,100 |
| 2018 | $1,091 | $41,400 | $3,300 | $38,100 |
| 2017 | $124 | $41,400 | $3,300 | $38,100 |
| 2016 | $1,068 | $41,400 | $3,300 | $38,100 |
| 2015 | $1,037 | $41,400 | $3,300 | $38,100 |
| 2014 | $1,035 | $41,400 | $3,300 | $38,100 |
Source: Public Records
Map
Nearby Homes
- 162 Liborio Dr
- 610 Louis Ln
- 447 Toftrees Dr
- 264 Trellis Ln
- 211 Lake Seymour Dr
- 79 Lattice Ln
- 14 W Lake St
- 148 Gazebo Ln
- 11 E Lockwood St
- 25 Franklin Dr
- 113 Crawford St
- 11 W Hoffecker St
- 129 E Main St
- 561 Whispering Trail
- 12 E Cochran St
- 659 Warren Dr
- 3 Redding Cir
- 8 Redding Cir
- 108 E Cochran St
- 49 Springmill Dr
Your Personal Tour Guide
Ask me questions while you tour the home.