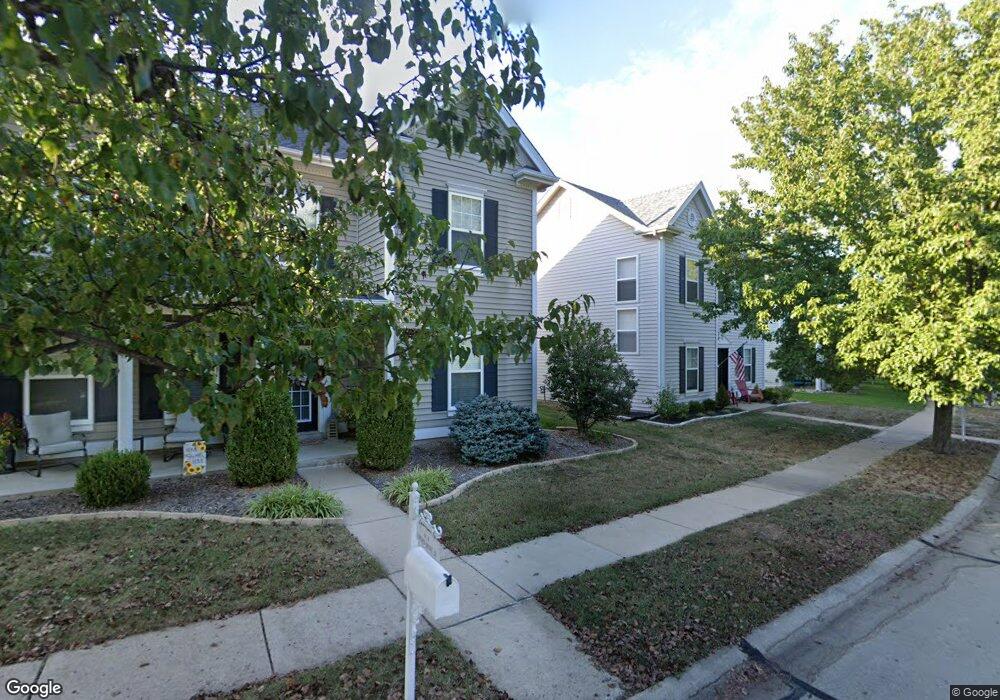
409 Covered Bridge Ln O Fallon, MO 63368
Estimated Value: $297,000 - $307,000
2
Beds
2
Baths
1,512
Sq Ft
$200/Sq Ft
Est. Value
About This Home
This home is located at 409 Covered Bridge Ln, O Fallon, MO 63368 and is currently estimated at $301,947, approximately $199 per square foot. 409 Covered Bridge Ln is a home located in St. Charles County with nearby schools including Twin Chimneys Elementary School, Fort Zumwalt West Middle School, and Fort Zumwalt West High School.
Ownership History
Date
Name
Owned For
Owner Type
Purchase Details
Closed on
Jul 6, 2022
Sold by
Irwin David C and Irwin Cherie E
Bought by
Rizner Amy and Pennell James Earl
Current Estimated Value
Home Financials for this Owner
Home Financials are based on the most recent Mortgage that was taken out on this home.
Original Mortgage
$246,500
Outstanding Balance
$234,537
Interest Rate
5.1%
Mortgage Type
New Conventional
Estimated Equity
$67,410
Purchase Details
Closed on
Apr 3, 2003
Sold by
The Jones Co Homes Llc
Bought by
Irwin David C and Irwin Cherie E
Home Financials for this Owner
Home Financials are based on the most recent Mortgage that was taken out on this home.
Original Mortgage
$121,176
Interest Rate
5.64%
Mortgage Type
Purchase Money Mortgage
Create a Home Valuation Report for This Property
The Home Valuation Report is an in-depth analysis detailing your home's value as well as a comparison with similar homes in the area
Home Values in the Area
Average Home Value in this Area
Purchase History
| Date | Buyer | Sale Price | Title Company |
|---|---|---|---|
| Rizner Amy | -- | New Title Company Name | |
| Irwin David C | $151,470 | -- |
Source: Public Records
Mortgage History
| Date | Status | Borrower | Loan Amount |
|---|---|---|---|
| Open | Rizner Amy | $246,500 | |
| Previous Owner | Irwin David C | $121,176 | |
| Closed | Irwin David C | $22,721 |
Source: Public Records
Tax History
| Year | Tax Paid | Tax Assessment Tax Assessment Total Assessment is a certain percentage of the fair market value that is determined by local assessors to be the total taxable value of land and additions on the property. | Land | Improvement |
|---|---|---|---|---|
| 2025 | $2,916 | $47,019 | -- | -- |
| 2023 | $2,919 | $45,184 | $0 | $0 |
| 2022 | $2,593 | $37,407 | $0 | $0 |
| 2021 | $2,600 | $37,407 | $0 | $0 |
| 2020 | $2,122 | $29,050 | $0 | $0 |
| 2019 | $2,130 | $29,050 | $0 | $0 |
| 2018 | $2,185 | $28,493 | $0 | $0 |
| 2017 | $2,161 | $28,493 | $0 | $0 |
| 2016 | $1,959 | $24,882 | $0 | $0 |
| 2015 | $1,806 | $24,882 | $0 | $0 |
| 2014 | $1,679 | $23,808 | $0 | $0 |
Source: Public Records
Map
Nearby Homes
- 572 Misty Mountain Dr
- 2671 Whitetail Ln
- 102 Riparian Dr
- 756 Thunder Hill Dr
- 101 Haven Ridge Ct Unit LOT 47
- 2613 Tysons Pkwy
- 149 Haven Ridge Ct
- New Build Savannah "E" at Dragonstone
- 711 Red Hawk Place
- 47 Landyn Ct
- 321 Hawks View Dr
- New Build Glacier "E" at Dragonstone
- 7 Dragonstone Ct
- 3 Dragonstone Ct
- 312 Chestnut Creek Cir
- 1166 Saint Theresa Dr
- 20 White Chapel Ct
- 7409 Heathermoor Ln
- 10 Doris Ave
- 0 Unknown Unit MIS22064590
- 407 Covered Bridge Ln
- 411 Covered Bridge Ln
- 405 Covered Bridge Ln
- 415 Covered Bridge Ln
- 417 Covered Bridge Ln
- 476 Boardwalk Springs Place
- 474 Boardwalk Springs Place
- 404 Covered Bridge Ln
- 403 Covered Bridge Ln
- 478 Boardwalk Springs Place
- 472 Boardwalk Springs Place
- 419 Covered Bridge Ln
- 406 Covered Bridge Ln
- 480 Boardwalk Springs Place
- 470 Boardwalk Springs Place
- 408 Covered Bridge Ln
- 468 Boardwalk Springs Place
- 482 Boardwalk Springs Place
- 410 Covered Bridge Ln
- 423 Covered Bridge Ln
Your Personal Tour Guide
Ask me questions while you tour the home.