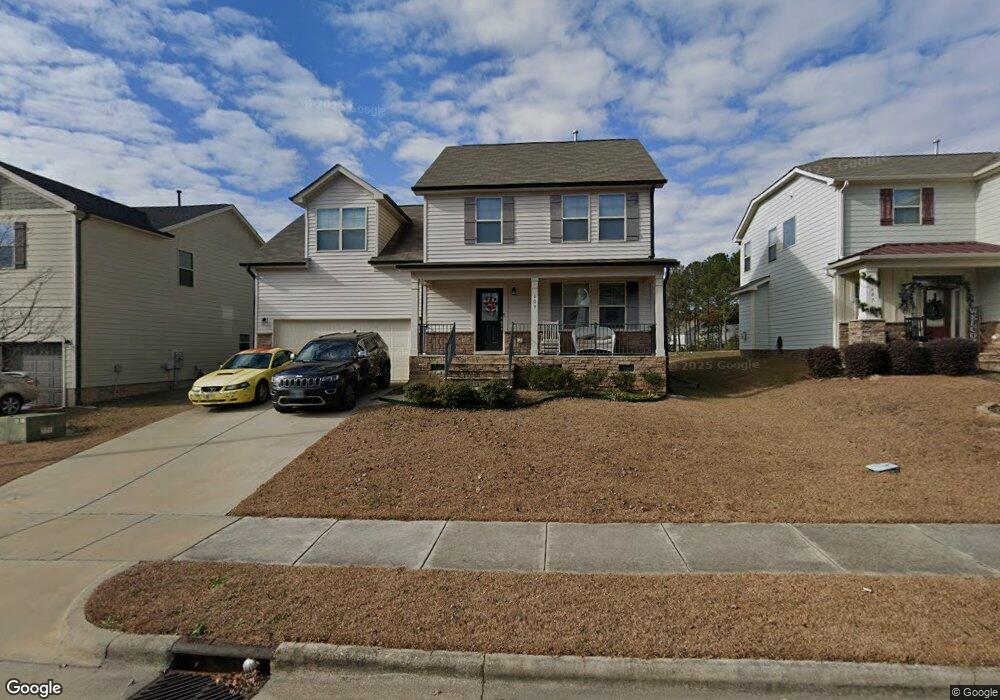
409 Crosstie St Knightdale, NC 27545
Estimated Value: $361,000 - $393,000
4
Beds
3
Baths
1,920
Sq Ft
$193/Sq Ft
Est. Value
About This Home
This home is located at 409 Crosstie St, Knightdale, NC 27545 and is currently estimated at $371,029, approximately $193 per square foot. 409 Crosstie St is a home located in Wake County with nearby schools including Knightdale Elementary School, Neuse River Middle School, and Knightdale High.
Ownership History
Date
Name
Owned For
Owner Type
Purchase Details
Closed on
Jun 26, 2020
Sold by
Machrouh Yassine El and Boujmad Laila
Bought by
Simon Kenard Leon and Kelly Asiya
Current Estimated Value
Home Financials for this Owner
Home Financials are based on the most recent Mortgage that was taken out on this home.
Original Mortgage
$8,000
Outstanding Balance
$7,098
Interest Rate
3.13%
Mortgage Type
New Conventional
Estimated Equity
$363,931
Purchase Details
Closed on
Jun 29, 2016
Sold by
Wilson Parker Homes Brookfield Station I
Bought by
Machrouh Yassine Ei and Boujmad Laila
Home Financials for this Owner
Home Financials are based on the most recent Mortgage that was taken out on this home.
Original Mortgage
$164,739
Interest Rate
3.58%
Mortgage Type
USDA
Create a Home Valuation Report for This Property
The Home Valuation Report is an in-depth analysis detailing your home's value as well as a comparison with similar homes in the area
Home Values in the Area
Average Home Value in this Area
Purchase History
| Date | Buyer | Sale Price | Title Company |
|---|---|---|---|
| Simon Kenard Leon | $256,000 | None Available | |
| Machrouh Yassine Ei | $132,000 | None Available |
Source: Public Records
Mortgage History
| Date | Status | Borrower | Loan Amount |
|---|---|---|---|
| Open | Simon Kenard Leon | $8,000 | |
| Open | Simon Kenard Leon | $248,320 | |
| Previous Owner | Machrouh Yassine Ei | $164,739 | |
| Previous Owner | Machrouh Yassine Ei | $18,190 |
Source: Public Records
Tax History Compared to Growth
Tax History
| Year | Tax Paid | Tax Assessment Tax Assessment Total Assessment is a certain percentage of the fair market value that is determined by local assessors to be the total taxable value of land and additions on the property. | Land | Improvement |
|---|---|---|---|---|
| 2025 | $3,387 | $351,794 | $85,000 | $266,794 |
| 2024 | $3,374 | $351,794 | $85,000 | $266,794 |
| 2023 | $2,654 | $237,928 | $55,000 | $182,928 |
| 2022 | $2,565 | $237,928 | $55,000 | $182,928 |
| 2021 | $2,447 | $237,928 | $55,000 | $182,928 |
| 2020 | $2,447 | $237,928 | $55,000 | $182,928 |
| 2019 | $2,208 | $190,136 | $38,000 | $152,136 |
| 2018 | $2,082 | $190,136 | $38,000 | $152,136 |
| 2017 | $2,007 | $190,136 | $38,000 | $152,136 |
| 2016 | $392 | $38,000 | $38,000 | $0 |
| 2015 | -- | $42,000 | $42,000 | $0 |
Source: Public Records
Map
Nearby Homes
- 302 Brakeman St
- 102 Switchback St
- 201 Heathwick Dr
- 216 Walbury Dr
- 116 Carrington Dr
- 307 S Smithfield Rd
- 413 Laurens Way
- 117 Stanway Dr
- 619 Laurens Way
- Jordan Plan at Glenmere - Gardens
- The Willow E Plan at Glenmere - Cove
- 506 Sternwheel Way
- 1456 Jay Rd
- 1466 Jay Rd
- 1463 Jay Rd
- 1452 Jay Rd
- 444 Haywood Glen Dr
- 1580 Goldfinch Perch Ln
- 1444 Jay Rd
- 1728 Goldfinch Perch Ln
- 407 Crosstie St
- 405 Crosstie St Unit 55
- 405 Crosstie St
- 314 Brakeman St
- 410 Crosstie St
- 408 Crosstie St Unit 21
- 408 Crosstie St
- 403 Crosstie St Unit 54
- 403 Crosstie St
- 406 Crosstie St Unit 20
- 406 Crosstie St
- 312 Brakeman St
- 412 Crosstie St
- 412 Crosstie St Unit 23
- 319 Brakeman St Unit 27
- 319 Brakeman St
- 317 Brakeman St
- 404 Crosstie St Unit 19
- 404 Crosstie St
- 514 Crosstie St