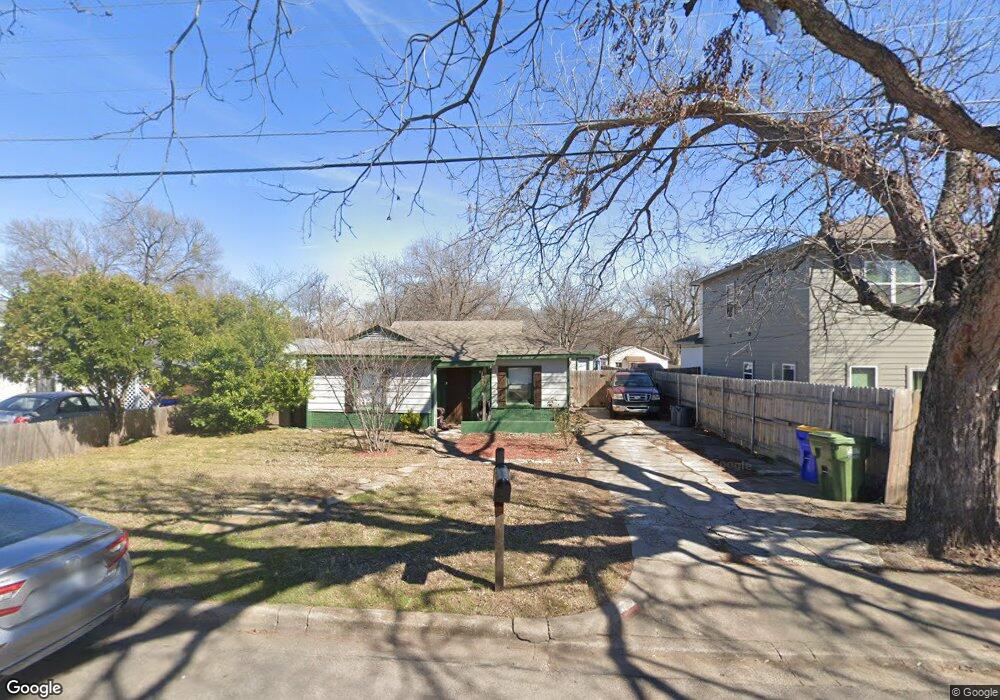
409 Dale Ln Fort Worth, TX 76108
Estimated Value: $177,000 - $201,000
2
Beds
1
Bath
998
Sq Ft
$190/Sq Ft
Est. Value
About This Home
This home is located at 409 Dale Ln, Fort Worth, TX 76108 and is currently estimated at $189,456, approximately $189 per square foot. 409 Dale Ln is a home located in Tarrant County with nearby schools including West Elementary School, Brewer Middle School, and Tannahill Intermediate School.
Ownership History
Date
Name
Owned For
Owner Type
Purchase Details
Closed on
Oct 31, 2019
Sold by
Capital Plus Financial Llc
Bought by
Campos Wesley Micheal
Current Estimated Value
Home Financials for this Owner
Home Financials are based on the most recent Mortgage that was taken out on this home.
Original Mortgage
$106,400
Outstanding Balance
$93,790
Interest Rate
3.7%
Mortgage Type
New Conventional
Estimated Equity
$95,666
Purchase Details
Closed on
Sep 14, 2018
Sold by
Rios Kay
Bought by
Capital Plus Financial Llc
Home Financials for this Owner
Home Financials are based on the most recent Mortgage that was taken out on this home.
Original Mortgage
$72,480
Interest Rate
4.5%
Mortgage Type
New Conventional
Purchase Details
Closed on
Jun 23, 1997
Sold by
Conner Linda
Bought by
Rios Gilbert
Purchase Details
Closed on
Jan 3, 1994
Sold by
Cecil Margaret Charlene
Bought by
Rios Phillipe and Conner Linda
Create a Home Valuation Report for This Property
The Home Valuation Report is an in-depth analysis detailing your home's value as well as a comparison with similar homes in the area
Home Values in the Area
Average Home Value in this Area
Purchase History
| Date | Buyer | Sale Price | Title Company |
|---|---|---|---|
| Campos Wesley Micheal | -- | None Available | |
| Capital Plus Financial Llc | -- | Lawyers Title | |
| Rios Gilbert | -- | -- | |
| Rios Phillipe | -- | -- |
Source: Public Records
Mortgage History
| Date | Status | Borrower | Loan Amount |
|---|---|---|---|
| Open | Campos Wesley Micheal | $106,400 | |
| Previous Owner | Capital Plus Financial Llc | $72,480 |
Source: Public Records
Tax History Compared to Growth
Tax History
| Year | Tax Paid | Tax Assessment Tax Assessment Total Assessment is a certain percentage of the fair market value that is determined by local assessors to be the total taxable value of land and additions on the property. | Land | Improvement |
|---|---|---|---|---|
| 2025 | $2,295 | $215,348 | $34,820 | $180,528 |
| 2024 | $2,295 | $215,348 | $34,820 | $180,528 |
| 2023 | $3,512 | $202,646 | $34,820 | $167,826 |
| 2022 | $3,636 | $175,927 | $25,000 | $150,927 |
| 2021 | $3,358 | $148,037 | $25,000 | $123,037 |
| 2020 | $3,075 | $110,974 | $25,000 | $85,974 |
| 2019 | $2,433 | $84,580 | $25,000 | $59,580 |
| 2018 | $2,053 | $71,356 | $12,000 | $59,356 |
| 2017 | $1,559 | $53,352 | $12,000 | $41,352 |
| 2016 | $1,196 | $40,941 | $12,000 | $28,941 |
| 2015 | $956 | $33,300 | $12,400 | $20,900 |
| 2014 | $956 | $33,300 | $12,400 | $20,900 |
Source: Public Records
Map
Nearby Homes
- 2860 Fox Trail Ln
- 10937 Elata Dr
- 9100 Rowland Dr
- 9200 Farmers Rd
- 9221 White Settlement Rd
- 9104 Farmers Rd
- 641 S Redford Ln
- 204 Lanham Ct
- 508 Grant Cir
- 428 S Las Vegas Trail
- 405 S Las Vegas Trail
- 407 S Las Vegas Trail
- 409 S Las Vegas Trail
- 411 S Las Vegas Trail
- 201 N Normandale St
- 501 Allencrest Dr
- 8528 Pemberton Ct
- 105 Lockwood St
- 8552 Gibbs Dr
- 800 Pemberton St
- 412 S Mcentire Ct
- 405 Dale Ln
- 401 Dale Ln
- 416 S Mcentire Ct
- 420 S Mcentire Ct
- 409 S Mcentire Ct
- 405 S Mcentire Ct
- 413 S Mcentire Ct
- 401 S Mcentire Ct
- 421 S Mcentire Ct
- 417 S Mcentire Ct
- 9228 Rowland Dr
- 9224 Rowland Dr
- 408 Sands Ct
- 9220 Rowland Dr
- 404 Sands Ct
- 9216 Rowland Dr
- 400 Sands Ct
- 9220 N Dodson Dr
- 9216 N Dodson Dr