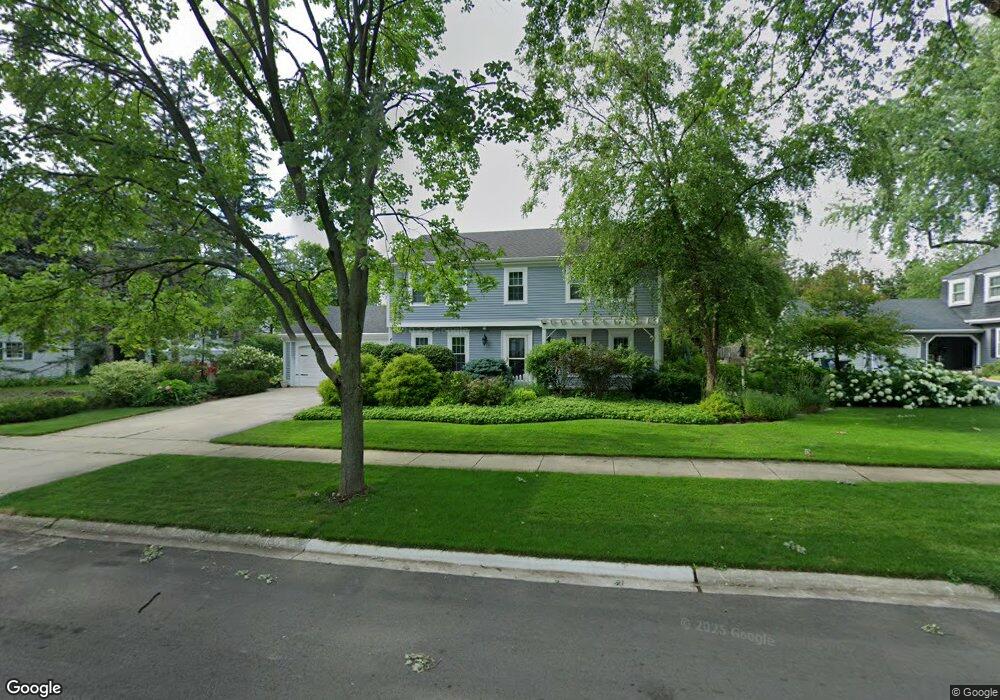
409 E 11th Ave Naperville, IL 60563
North Naperville NeighborhoodEstimated Value: $673,518 - $780,000
4
Beds
3
Baths
2,648
Sq Ft
$273/Sq Ft
Est. Value
About This Home
This home is located at 409 E 11th Ave, Naperville, IL 60563 and is currently estimated at $721,880, approximately $272 per square foot. 409 E 11th Ave is a home located in DuPage County with nearby schools including Beebe Elementary School, Jefferson Jr High School, and Naperville North High School.
Ownership History
Date
Name
Owned For
Owner Type
Purchase Details
Closed on
Sep 16, 2017
Sold by
Vilim Stephen G
Bought by
Vilim Stephen G and The Stephen G Vilim Living Trust
Current Estimated Value
Home Financials for this Owner
Home Financials are based on the most recent Mortgage that was taken out on this home.
Original Mortgage
$355,000
Outstanding Balance
$295,247
Interest Rate
3.75%
Mortgage Type
New Conventional
Estimated Equity
$426,633
Purchase Details
Closed on
Aug 31, 2017
Sold by
Hixon Martha A and The Martha A Hixon 2001 Declar
Bought by
Vilim Stephen G
Home Financials for this Owner
Home Financials are based on the most recent Mortgage that was taken out on this home.
Original Mortgage
$355,000
Outstanding Balance
$295,247
Interest Rate
3.75%
Mortgage Type
New Conventional
Estimated Equity
$426,633
Purchase Details
Closed on
May 22, 2001
Sold by
Hixon Martha A
Bought by
The Martha A Hixon 2001 Declaration Tr
Create a Home Valuation Report for This Property
The Home Valuation Report is an in-depth analysis detailing your home's value as well as a comparison with similar homes in the area
Home Values in the Area
Average Home Value in this Area
Purchase History
| Date | Buyer | Sale Price | Title Company |
|---|---|---|---|
| Vilim Stephen G | -- | Attorney | |
| Vilim Stephen G | -- | Stewart Title | |
| The Martha A Hixon 2001 Declaration Tr | -- | -- |
Source: Public Records
Mortgage History
| Date | Status | Borrower | Loan Amount |
|---|---|---|---|
| Open | Vilim Stephen G | $355,000 |
Source: Public Records
Tax History
| Year | Tax Paid | Tax Assessment Tax Assessment Total Assessment is a certain percentage of the fair market value that is determined by local assessors to be the total taxable value of land and additions on the property. | Land | Improvement |
|---|---|---|---|---|
| 2024 | $11,839 | $201,258 | $79,975 | $121,283 |
| 2023 | $11,416 | $183,680 | $72,990 | $110,690 |
| 2022 | $11,299 | $180,590 | $69,900 | $110,690 |
| 2021 | $10,351 | $173,760 | $67,260 | $106,500 |
| 2020 | $10,659 | $170,640 | $66,050 | $104,590 |
| 2019 | $10,351 | $163,260 | $63,190 | $100,070 |
| 2018 | $10,116 | $159,650 | $63,190 | $96,460 |
| 2017 | $9,581 | $154,270 | $61,060 | $93,210 |
| 2016 | $9,378 | $148,690 | $58,850 | $89,840 |
| 2015 | $9,300 | $140,020 | $55,420 | $84,600 |
| 2014 | $9,203 | $134,640 | $53,290 | $81,350 |
| 2013 | $9,066 | $134,970 | $53,420 | $81,550 |
Source: Public Records
Map
Nearby Homes
- 952 N Loomis St
- 930 N Loomis St
- 5S661 Wright St
- 837 N Loomis St
- 809 N Brainard St
- 26W250 Case St
- 719 N Brainard St
- 717 N Brainard St
- 715 N Brainard St
- 825 Biltmore Ct
- 1142 N Webster St
- 905 N Webster St
- 634 E 5th Ave
- 1310 Eagle St
- 1314 N Eagle St
- 636 E 4th Ave
- 5S365 Vest Ave
- 340 N Wright St
- 1052 N Mill St Unit 111
- 906 Coletta Cir
- 413 E 11th Ave
- 1104 N Loomis St
- 505 E 11th Ave
- 408 E 11th Ave
- 412 E 11th Ave
- 1108 N Loomis St
- 416 Blue Grass Ct
- 504 E 11th Ave
- 412 Blue Grass Ct Unit 2
- 420 Blue Grass Ct
- 509 E 11th Ave
- 404 Blue Grass Ct Unit 2
- 508 E 11th Ave
- 958 N Loomis St
- 971 N Sleight St
- 424 Blue Grass Ct
- 1105 N Loomis St
- 316 E 11th Ave
- 512 E 11th Ave
Your Personal Tour Guide
Ask me questions while you tour the home.