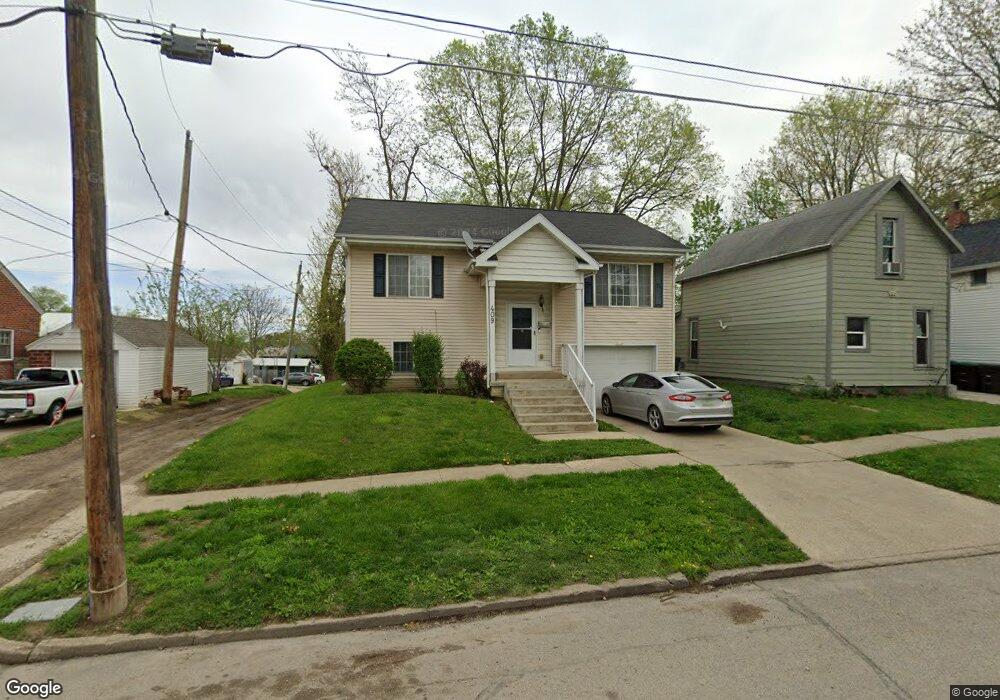
409 E 17th St Des Moines, IA 50316
Capitol East NeighborhoodEstimated Value: $154,000 - $264,000
4
Beds
2
Baths
1,015
Sq Ft
$191/Sq Ft
Est. Value
About This Home
This home is located at 409 E 17th St, Des Moines, IA 50316 and is currently estimated at $193,842, approximately $190 per square foot. 409 E 17th St is a home located in Polk County with nearby schools including Capitol View Elementary School, Hiatt Middle School, and East High School.
Ownership History
Date
Name
Owned For
Owner Type
Purchase Details
Closed on
Feb 23, 2011
Sold by
Federal National Mortgage Association
Bought by
Mcclish Todd
Current Estimated Value
Home Financials for this Owner
Home Financials are based on the most recent Mortgage that was taken out on this home.
Original Mortgage
$65,000
Outstanding Balance
$44,436
Interest Rate
4.76%
Mortgage Type
Future Advance Clause Open End Mortgage
Estimated Equity
$149,406
Purchase Details
Closed on
Dec 9, 2010
Sold by
Iowa Bankers Mortgage Corporation
Bought by
Federal National Mortgage Association
Purchase Details
Closed on
Nov 9, 2007
Sold by
Ruperto Construction Lc
Bought by
Pinos Elvia and Pinos Raimundo
Home Financials for this Owner
Home Financials are based on the most recent Mortgage that was taken out on this home.
Original Mortgage
$137,000
Interest Rate
6.44%
Mortgage Type
Purchase Money Mortgage
Purchase Details
Closed on
Feb 1, 2007
Sold by
Brantley Built Homes Llc
Bought by
Horizon Bank
Purchase Details
Closed on
Apr 16, 2004
Sold by
Spectrum Resources
Bought by
Brantley Built Homes
Create a Home Valuation Report for This Property
The Home Valuation Report is an in-depth analysis detailing your home's value as well as a comparison with similar homes in the area
Home Values in the Area
Average Home Value in this Area
Purchase History
| Date | Buyer | Sale Price | Title Company |
|---|---|---|---|
| Mcclish Todd | -- | None Available | |
| Federal National Mortgage Association | $156,000 | None Available | |
| Pinos Elvia | $136,500 | None Available | |
| Horizon Bank | -- | None Available | |
| Brantley Built Homes | -- | -- |
Source: Public Records
Mortgage History
| Date | Status | Borrower | Loan Amount |
|---|---|---|---|
| Open | Mcclish Todd | $65,000 | |
| Previous Owner | Pinos Elvia | $137,000 |
Source: Public Records
Tax History
| Year | Tax Paid | Tax Assessment Tax Assessment Total Assessment is a certain percentage of the fair market value that is determined by local assessors to be the total taxable value of land and additions on the property. | Land | Improvement |
|---|---|---|---|---|
| 2025 | $3,298 | $190,700 | $7,000 | $183,700 |
| 2024 | $3,298 | $167,600 | $6,100 | $161,500 |
| 2023 | $3,106 | $167,600 | $6,100 | $161,500 |
| 2022 | $3,082 | $131,800 | $4,900 | $126,900 |
| 2021 | $2,894 | $131,800 | $4,900 | $126,900 |
| 2020 | $3,008 | $116,000 | $4,300 | $111,700 |
| 2019 | $2,954 | $116,000 | $4,300 | $111,700 |
| 2018 | $212 | $109,900 | $3,600 | $106,300 |
| 2017 | $68 | $109,900 | $3,600 | $106,300 |
| 2016 | $66 | $102,600 | $3,300 | $99,300 |
| 2015 | $66 | $102,600 | $3,300 | $99,300 |
| 2014 | $66 | $99,500 | $3,300 | $96,200 |
Source: Public Records
Map
Nearby Homes
- 1804 Capitol Ave
- 1621 Des Moines St
- 1613 Des Moines St
- 1807 E Walnut St
- 1609 E Court Ave
- 2024 Capitol Ave
- 2050 E Grand Ave
- 1211 Sampson St
- 1213 Sampson St
- 104 E 15th St
- 1266 E 18th St
- 2057 Maple St
- 1273 E 18th St
- 1251 Sampson St
- 1303 E 17th St
- 2216 Logan Ave
- 2224 Capitol Ave
- 2228 Capitol Ave
- 1349 de Wolf St
- 1404 E 19th St
- 405 E 17th St
- 403 E 17th St
- 1706 Capitol Ave
- 1710 Capitol Ave
- 417 E 17th St
- 410 E 17th St
- 1709 E Grand Ave
- 1703 E Grand Ave
- 1712 Capitol Ave
- 1650 Capitol Ave
- 1711 E Grand Ave
- 1718 Capitol Ave
- 1648 Capitol Ave
- 1649 E Grand Ave
- 1653 E Grand Ave
- 1720 Capitol Ave
- 1646 Capitol Ave
- 1701 Capitol Ave
- 1705 Capitol Ave
Your Personal Tour Guide
Ask me questions while you tour the home.