K
Seller's Agent in 2013
Kevin Graham
Century 21 Real Estate Assoc
(217) 789-7200
51 Total Sales

Estimated Value: $73,000 - $111,000
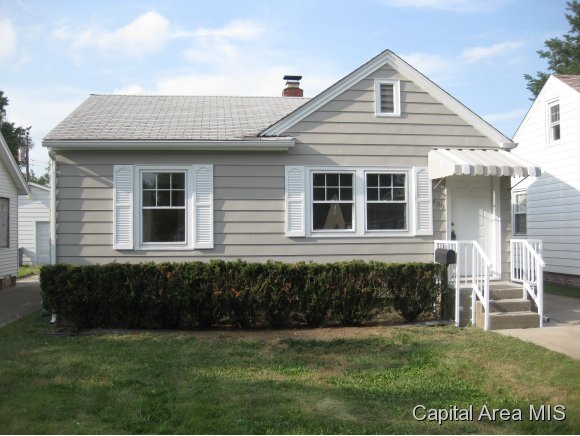
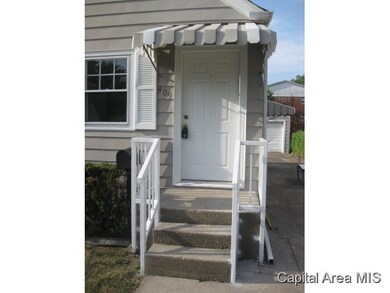
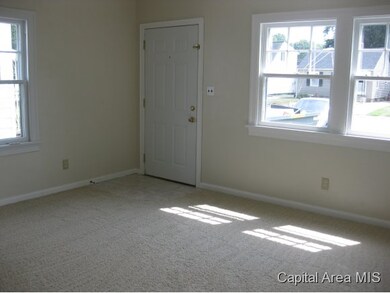
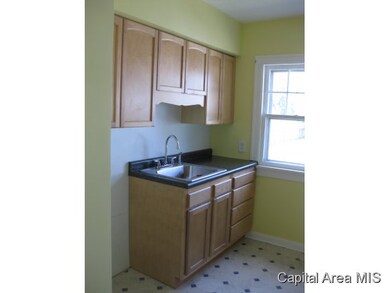
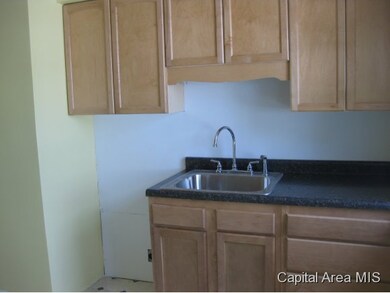
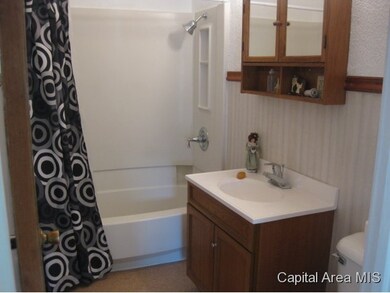
CUTE BUNGALOW ALL READY FOR YOU TO MOVE RIGHT IN! NEW FLOORING THRU OUT & FRESH PAINT. CARPET HAS A 15 YEAR WARRANTY! NEW KITCHEN CABINETS & COUNTERTOPS, BRAND NEW CENTRAL AIR, UPDATED BATHROOM, FRESHLY PAINTED EXTERIOR, TOO. SELLERS ARE OFFERING $1500 APPLIANCE ALLOWANCE!! 1.5 CAR DETACHED GARAGE. GREAT LOCATION IS SOUTHERN VIEW WITH A QUIET STREET! THIS IS A MUST SEE!!
Last Agent to Sell the Property
Century 21 Real Estate Assoc License #471002687 Listed on: 08/29/2013
| Date | Buyer | Sale Price | Title Company |
|---|---|---|---|
| -- | $60,000 | -- | |
| -- | -- | -- | |
| -- | $55,000 | -- | |
| -- | $58,500 | -- |
| Date | Event | Price | List to Sale | Price per Sq Ft |
|---|---|---|---|---|
| 12/23/2013 12/23/13 | Sold | $60,000 | -14.2% | $82 / Sq Ft |
| 11/23/2013 11/23/13 | Pending | -- | -- | -- |
| 08/29/2013 08/29/13 | For Sale | $69,900 | -- | $96 / Sq Ft |
| Year | Tax Paid | Tax Assessment Tax Assessment Total Assessment is a certain percentage of the fair market value that is determined by local assessors to be the total taxable value of land and additions on the property. | Land | Improvement |
|---|---|---|---|---|
| 2024 | $1,682 | $26,313 | $6,382 | $19,931 |
| 2023 | $1,610 | $24,364 | $5,909 | $18,455 |
| 2022 | $1,516 | $23,057 | $5,592 | $17,465 |
| 2021 | $1,452 | $22,153 | $5,373 | $16,780 |
| 2020 | $1,396 | $21,912 | $5,315 | $16,597 |
| 2019 | $1,338 | $21,529 | $5,222 | $16,307 |
| 2018 | $1,290 | $21,437 | $5,200 | $16,237 |
| 2017 | $1,252 | $21,108 | $5,120 | $15,988 |
| 2016 | $1,201 | $20,563 | $4,988 | $15,575 |
| 2015 | $1,168 | $20,098 | $4,875 | $15,223 |
| 2014 | $1,144 | $19,930 | $4,834 | $15,096 |
| 2013 | $1,132 | $20,144 | $4,886 | $15,258 |
K
Seller's Agent in 2013
Kevin Graham
Century 21 Real Estate Assoc
(217) 789-7200
51 Total Sales

Buyer's Agent in 2013
JAMI WINCHESTER
The Real Estate Group, Inc.
(217) 306-1000
1,419 Total Sales
Source: RMLS Alliance
MLS Number: RMACA134853
APN: 22-09.0-478-004
Disclaimer: Certain information contained herein is derived from information provided by parties other than Homes.com. All information provided is deemed reliable, but is not guaranteed to be accurate and should be independently verified.
![]() Based on information submitted to the MLS GRID. All data is obtained from various sources and may not have been verified by broker or MLS GRID. Supplied Open House Information is subject to change without notice. All information should be independently reviewed and verified for accuracy. Properties may or may not be listed by the office/agent presenting the information. Some IDX listings have been excluded from this website.IDX information is provided exclusively for personal, non-commercial use, and may not be used for any purpose other than to identify prospective properties consumers may be interested in purchasing. Information is deemed reliable but not guaranteed.
Based on information submitted to the MLS GRID. All data is obtained from various sources and may not have been verified by broker or MLS GRID. Supplied Open House Information is subject to change without notice. All information should be independently reviewed and verified for accuracy. Properties may or may not be listed by the office/agent presenting the information. Some IDX listings have been excluded from this website.IDX information is provided exclusively for personal, non-commercial use, and may not be used for any purpose other than to identify prospective properties consumers may be interested in purchasing. Information is deemed reliable but not guaranteed.
Based on information submitted to the MLS GRID
Ask me questions while you tour the home.